Unlock a world of possibilities! Login now and discover the exclusive benefits awaiting you.
- Qlik Community
- :
- All Forums
- :
- QlikView App Dev
- :
- Time series colors only work for selected time per...
- Subscribe to RSS Feed
- Mark Topic as New
- Mark Topic as Read
- Float this Topic for Current User
- Bookmark
- Subscribe
- Mute
- Printer Friendly Page
- Mark as New
- Bookmark
- Subscribe
- Mute
- Subscribe to RSS Feed
- Permalink
- Report Inappropriate Content
Time series colors only work for selected time period
Hi,
I have a chart that shows a total count over time for four different locations. I suspect the root of my problem is that "Show All Values" isn't working for YearMonth in the Dimension tab. It still shows only the YearMonth that I have selected. I've tried deselecting "Suppress Zero-Values" and "Suppress Missing" in the Presentation tab, but that hasn't worked. I was able to show the entire time period in the chart by using set analysis in my expression: Count({<YearMonth=>} FieldName).
But now I have a problem with the chart expression background colors in that if I have a YearMonth selected, all other time periods in the chart display default colors rather than the colors I've specified. Here's what I mean:
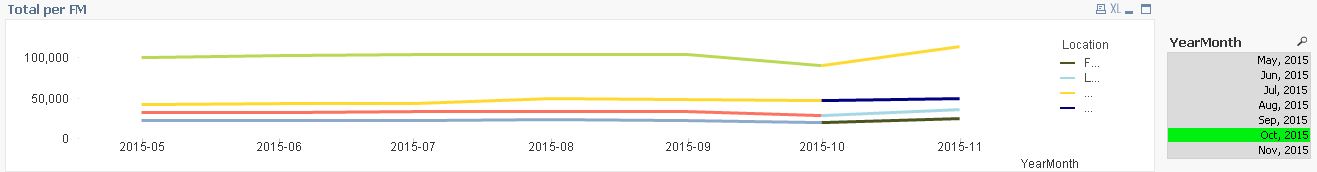
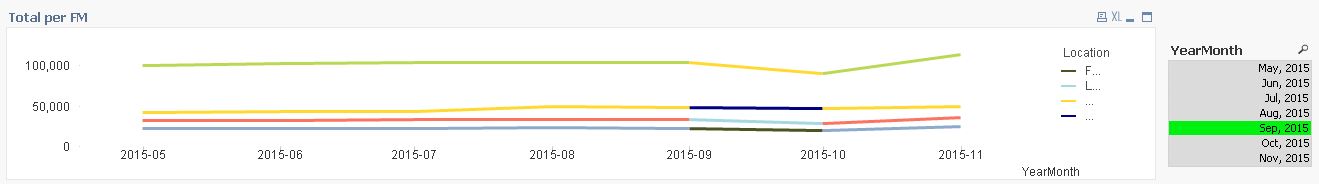
I'm not sure why it would do that. But I have a feeling that correcting the "Show All Values" problem and removing the set analysis part would fix the problem. Sorry, I can't post my application. Does anyone have any ideas that could help me?
Accepted Solutions
- Mark as New
- Bookmark
- Subscribe
- Mute
- Subscribe to RSS Feed
- Permalink
- Report Inappropriate Content
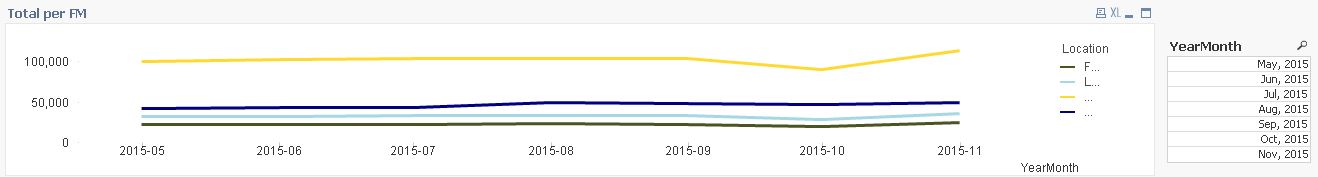
Try this:
Pick(Match(Only({<YearMonth>}Location),'Loc1','Loc2','Loc3','Loc4'),
RGB(255,217,47),RGB(0,0,128),RGB(166,216,227),RGB(75,83,32))
- Mark as New
- Bookmark
- Subscribe
- Mute
- Subscribe to RSS Feed
- Permalink
- Report Inappropriate Content
What is the expression you are using for the background color? You need to ignore selection in YearMonth in that expression as well.
- Mark as New
- Bookmark
- Subscribe
- Mute
- Subscribe to RSS Feed
- Permalink
- Report Inappropriate Content
Hi Sunny,
Thanks for the quick response. Here's my background color expression:
Pick(Match(Location,'Loc1','Loc2','Loc3','Loc4'),
RGB(255,217,47),RGB(0,0,128),RGB(166,216,227),RGB(75,83,32))
I've never had to ignore selections in other time series charts, but this chart is problematic for some reason, so I'm sure it's worth a try.
- Mark as New
- Bookmark
- Subscribe
- Mute
- Subscribe to RSS Feed
- Permalink
- Report Inappropriate Content
Try this:
Pick(Match(Only({<YearMonth>}Location),'Loc1','Loc2','Loc3','Loc4'),
RGB(255,217,47),RGB(0,0,128),RGB(166,216,227),RGB(75,83,32))
- Mark as New
- Bookmark
- Subscribe
- Mute
- Subscribe to RSS Feed
- Permalink
- Report Inappropriate Content
Thank you very much, Sunny!