Unlock a world of possibilities! Login now and discover the exclusive benefits awaiting you.
- Qlik Community
- :
- All Forums
- :
- QlikView App Dev
- :
- Top 10 using an expression
- Subscribe to RSS Feed
- Mark Topic as New
- Mark Topic as Read
- Float this Topic for Current User
- Bookmark
- Subscribe
- Mute
- Printer Friendly Page
- Mark as New
- Bookmark
- Subscribe
- Mute
- Subscribe to RSS Feed
- Permalink
- Report Inappropriate Content
Top 10 using an expression
I have created a pivot table with one dimension and multiple expressions. I need to create 2 more tables using the same information but I only want to pull the top 10 and the top 10 bottom based on one of the expressions.
Here is what the expression looks like:
if (sum({<FYEAR={$(vBenchYr)},QUARTER={'Q4'}>}(SALES_OVR))<>0,
1-((sum({<FYEAR={$(vCompYr)},QUARTER={$(vCompPrd)}>}(SALES_TOTAL))/sum({<FYEAR={$(vCompYr)},QUARTER={$(vCompPrd)}>}(QTY))*Column(3)) /
((sum({<FYEAR={$(vBenchYr)},QUARTER={'Q4'}>}(SALES_OVR))/sum({<FYEAR={$(vBenchYr)},QUARTER={'Q4'}>}(QTY_OVR)))*Column(3))),
1-((sum({<FYEAR={$(vCompYr)},QUARTER={$(vCompPrd)}>}(SALES_TOTAL))/sum({<FYEAR={$(vCompYr)},QUARTER={$(vCompPrd)}>}(QTY))*Column(3)) /
((sum({<FYEAR={$(vBenchYr)},QUARTER={'Q4'}>}(SALES_TOTAL))/sum({<FYEAR={$(vBenchYr)},QUARTER={'Q4'}>}(QTY)))*Column(3))))
Is there a way to only pull the top 10 & bottom 10 based on the value from this????
- « Previous Replies
-
- 1
- 2
- Next Replies »
- Mark as New
- Bookmark
- Subscribe
- Mute
- Subscribe to RSS Feed
- Permalink
- Report Inappropriate Content
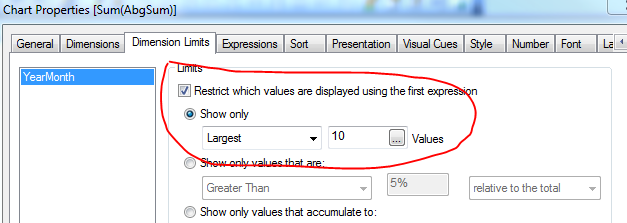
Dimension limits
- Mark as New
- Bookmark
- Subscribe
- Mute
- Subscribe to RSS Feed
- Permalink
- Report Inappropriate Content
- Mark as New
- Bookmark
- Subscribe
- Mute
- Subscribe to RSS Feed
- Permalink
- Report Inappropriate Content
It is an expression that I am trying to use & not a dimension.
- Mark as New
- Bookmark
- Subscribe
- Mute
- Subscribe to RSS Feed
- Permalink
- Report Inappropriate Content
this shows the dimensions that correspond to the top 10 expression values
largest 10 values means largest 10 expression values
- Mark as New
- Bookmark
- Subscribe
- Mute
- Subscribe to RSS Feed
- Permalink
- Report Inappropriate Content
How do I get this tab to show???? I don't see dimension limits tab
- Mark as New
- Bookmark
- Subscribe
- Mute
- Subscribe to RSS Feed
- Permalink
- Report Inappropriate Content
what chart type do you use? it is not available for all
- Mark as New
- Bookmark
- Subscribe
- Mute
- Subscribe to RSS Feed
- Permalink
- Report Inappropriate Content
Pivot table and also my dimension is set up as a group
- Mark as New
- Bookmark
- Subscribe
- Mute
- Subscribe to RSS Feed
- Permalink
- Report Inappropriate Content
do you want the top 10 and min 10 inside of the same expression ?
- Mark as New
- Bookmark
- Subscribe
- Mute
- Subscribe to RSS Feed
- Permalink
- Report Inappropriate Content
Not in the same expression.
- « Previous Replies
-
- 1
- 2
- Next Replies »