Unlock a world of possibilities! Login now and discover the exclusive benefits awaiting you.
- Qlik Community
- :
- All Forums
- :
- QlikView App Dev
- :
- Total line in combo chart to calculate first, not ...
- Subscribe to RSS Feed
- Mark Topic as New
- Mark Topic as Read
- Float this Topic for Current User
- Bookmark
- Subscribe
- Mute
- Printer Friendly Page
- Mark as New
- Bookmark
- Subscribe
- Mute
- Subscribe to RSS Feed
- Permalink
- Report Inappropriate Content
Total line in combo chart to calculate first, not second, dimension
I have a combo chart with two dimensions:
MonthName(Article_Viewed_At)
Calculated dimension: if(Incident_Opened_Within2hrs=0,'Call Avoided','Call Generated')
In my expressions I have:
Count(DISTINCT Article_Viewed_By) - Bar
I want to add a line showing the total volume for the first dimension but everything I have tried shows the line calculating for the second dimension causing the line to climb, then plummet, climb, then plummet because the calculated dimension is much smaller for call avoided.
Accepted Solutions
- Mark as New
- Bookmark
- Subscribe
- Mute
- Subscribe to RSS Feed
- Permalink
- Report Inappropriate Content
The SA solution will not behave the same as the If. With the SA, you are making a selection and overriding the selection made in the listbox.
I think you can get what you want with SA by adding a "*" (intersection) set operator.
Count({$ * <View_Incidents_Within_2h={0}>}DISTINCT View_Viewed_By)
-Rob
- Mark as New
- Bookmark
- Subscribe
- Mute
- Subscribe to RSS Feed
- Permalink
- Report Inappropriate Content
Instead of using two dimensions, why not use two expressions (and then you can add a third expression for the line):
Dimension: MonthName(Article_Viewed_At)
Expression 1 (Call Avoided): Count({<Incident_Opened_Within2hrs={0}>}DISTINCT Article_Viewed_By)
Expression 2 (Call Generated): Count({<Incident_Opened_Within2hrs-={0}>}DISTINCT Article_Viewed_By)
Expression 3: (something for your line)
- Mark as New
- Bookmark
- Subscribe
- Mute
- Subscribe to RSS Feed
- Permalink
- Report Inappropriate Content
When I apply a filter to show Incident_Opened_Within2hrs=0, the graph with 2 expressions works correctly but when I apply a filter to show >0, the chart does not change.
- Mark as New
- Bookmark
- Subscribe
- Mute
- Subscribe to RSS Feed
- Permalink
- Report Inappropriate Content
I don't know what you mean. Can you post a sample file?
Maybe try changing the second expression to:
Count({<Incident_Opened_Within2hrs={'>0'}>}DISTINCT Article_Viewed_By)
- Mark as New
- Bookmark
- Subscribe
- Mute
- Subscribe to RSS Feed
- Permalink
- Report Inappropriate Content
The 2 expressions work great when no selection is applied but when I apply a selection to Incident_Opened_Within2hrs where greater than 0 (Call Genereated), my chart does not change. The two expressions counts remain when Calls Avoided should become zero and disappear. If I change the expression to Count(DISTINCT if(Incident_Opened_Within2hrs>0,Article_Viewed_By)) it works correctly. I could try and create a sample later w/ data.
- Mark as New
- Bookmark
- Subscribe
- Mute
- Subscribe to RSS Feed
- Permalink
- Report Inappropriate Content
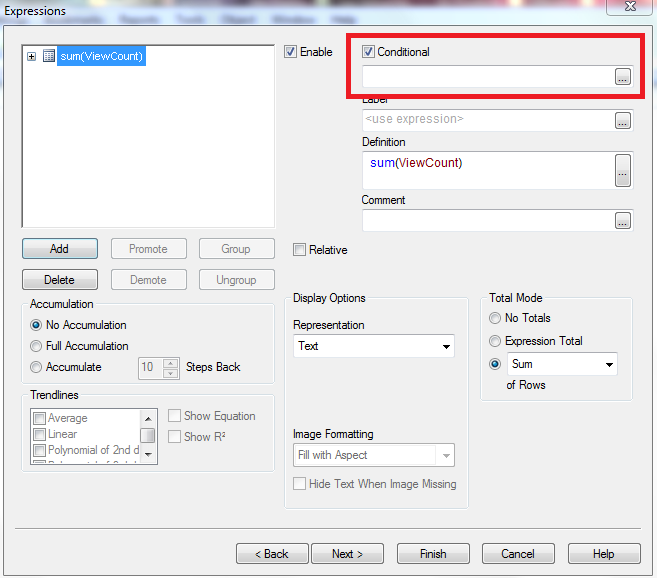
If you leave the expressions the way that they are, you may be able to add a conditional expression to them in order to show/hide them based on the selection that you're talking about:
I'm thinking on the Call Avoided: Count({<Incident_Opened_Within2hrs={0}>}DISTINCT Article_Viewed_By)>0
and on the Call Generated: Count({<Incident_Opened_Within2hrs-={0}>}DISTINCT Article_Viewed_By)>0
- Mark as New
- Bookmark
- Subscribe
- Mute
- Subscribe to RSS Feed
- Permalink
- Report Inappropriate Content
Attached sample. One chart with set analysis, the other with an IF statement. Apply a selection for call avoided vs generated and watch the graphs. Thanks for the help! The conditional I will try to avoid just because I feel the set analysis should work the same as the IF statement.
- Mark as New
- Bookmark
- Subscribe
- Mute
- Subscribe to RSS Feed
- Permalink
- Report Inappropriate Content
The SA solution will not behave the same as the If. With the SA, you are making a selection and overriding the selection made in the listbox.
I think you can get what you want with SA by adding a "*" (intersection) set operator.
Count({$ * <View_Incidents_Within_2h={0}>}DISTINCT View_Viewed_By)
-Rob
- Mark as New
- Bookmark
- Subscribe
- Mute
- Subscribe to RSS Feed
- Permalink
- Report Inappropriate Content
Rob Wunderlich's solution works (see the attached). I just learned something new 
- Mark as New
- Bookmark
- Subscribe
- Mute
- Subscribe to RSS Feed
- Permalink
- Report Inappropriate Content
Thanks for all the responses! I now have this working how I want. Thanks!