Unlock a world of possibilities! Login now and discover the exclusive benefits awaiting you.
- Qlik Community
- :
- All Forums
- :
- QlikView App Dev
- :
- Totals in table
- Subscribe to RSS Feed
- Mark Topic as New
- Mark Topic as Read
- Float this Topic for Current User
- Bookmark
- Subscribe
- Mute
- Printer Friendly Page
- Mark as New
- Bookmark
- Subscribe
- Mute
- Subscribe to RSS Feed
- Permalink
- Report Inappropriate Content
Totals in table
Hi There,
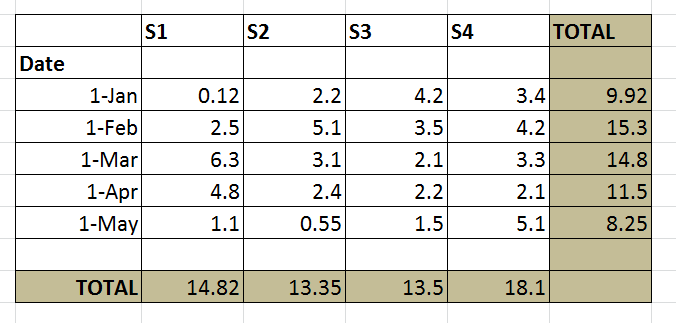
I'm trying to create a table/chart in QlikView to reflect the same characteristics as seen below.
How do I show the totals as seen in the picture below?
Thanks,

Accepted Solutions
- Mark as New
- Bookmark
- Subscribe
- Mute
- Subscribe to RSS Feed
- Permalink
- Report Inappropriate Content
Please see the attached and modify according to your needs. Hope this helps...

- Mark as New
- Bookmark
- Subscribe
- Mute
- Subscribe to RSS Feed
- Permalink
- Report Inappropriate Content
Create a Pivot Table Chart, with Date and S as dimensions and sum(x) as the expression.
On the Presentation Tab, enable partial sums for the Date and S dimensions.
- Mark as New
- Bookmark
- Subscribe
- Mute
- Subscribe to RSS Feed
- Permalink
- Report Inappropriate Content
Hi Mike,
i hope that helps
beck
- Mark as New
- Bookmark
- Subscribe
- Mute
- Subscribe to RSS Feed
- Permalink
- Report Inappropriate Content
Please see the attached and modify according to your needs. Hope this helps...

- Mark as New
- Bookmark
- Subscribe
- Mute
- Subscribe to RSS Feed
- Permalink
- Report Inappropriate Content
Pivot table is the right answer for you.
- Mark as New
- Bookmark
- Subscribe
- Mute
- Subscribe to RSS Feed
- Permalink
- Report Inappropriate Content
Thanks Colin,
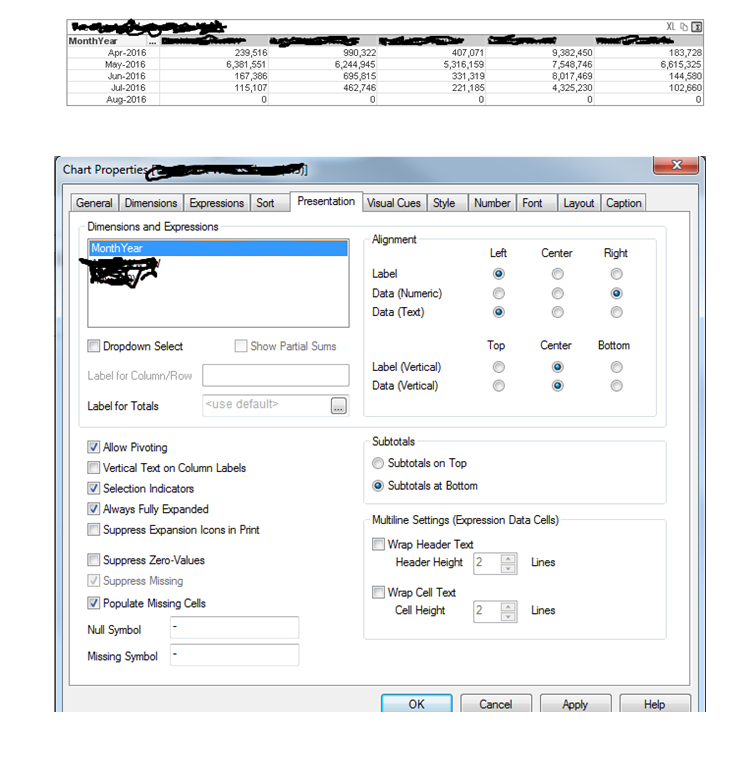
I have created the pivot table as seen below. The S1, S2 etc in the previous sample table represent a location. The values seen in the table is a set analysis which calculates a particular measure. The Dimensions as you can see is MonthYear and S. However, I've manually moved S to horizontal position as this is what the end-user requires.
The only issue is that the options on the presentation tab you are suggesting is not available. I would have at least expected the 'Subtotals at Bottom' to work but this resulted in the table as seen in the table below. I do however get the totals at the bottom if the chart is a straight table but the format of the straight table is definitely what I do NOT want.

- Mark as New
- Bookmark
- Subscribe
- Mute
- Subscribe to RSS Feed
- Permalink
- Report Inappropriate Content
Perfect!
Thanks to all who contributed.
- Mark as New
- Bookmark
- Subscribe
- Mute
- Subscribe to RSS Feed
- Permalink
- Report Inappropriate Content
Have you selected "Show Partial Sums" for the dimensions you wish to total?