Unlock a world of possibilities! Login now and discover the exclusive benefits awaiting you.
- Qlik Community
- :
- All Forums
- :
- QlikView App Dev
- :
- Tough Mekko Question - Labels
- Subscribe to RSS Feed
- Mark Topic as New
- Mark Topic as Read
- Float this Topic for Current User
- Bookmark
- Subscribe
- Mute
- Printer Friendly Page
- Mark as New
- Bookmark
- Subscribe
- Mute
- Subscribe to RSS Feed
- Permalink
- Report Inappropriate Content
Tough Mekko Question - Labels
hi all,
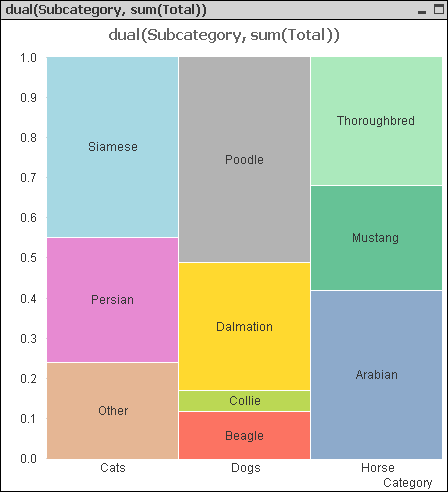
I am trying to make a Mekko Chart with the breakdown of 3 Animal Categories and their subcategories. On the x axis I have Cat, Dog, Horse, and on the Y axis I have 0-100%. Can I make the mekko show the Sub Categories (Poodle, Collie, Dalmation) as the labels instead of the % values??
I have attached a spreadsheet with the values. I really appreciate your help!
Accepted Solutions
- Mark as New
- Bookmark
- Subscribe
- Mute
- Subscribe to RSS Feed
- Permalink
- Report Inappropriate Content
You can use the dual function for this. You also need to enable the Plot Values Inside Segments option on the Presentation tab of the properties window. You do lose the option to format the Y-axis values as percentages though:
See attached example.
talk is cheap, supply exceeds demand
- Mark as New
- Bookmark
- Subscribe
- Mute
- Subscribe to RSS Feed
- Permalink
- Report Inappropriate Content
Thank you so much - that was brilliant!
I have two follow up questions on this:
1. Is it possible to wrap the labels to fit the chart? I provided a simple sample of my full data so some of the labels are really long and don't fit the boxes.
2. Can you ever do a second drill down to this? As in, if I wanted to drill down into Persian to see the names of the owners, would I be able to do that? The dual function appears to have only one text string and one numerical value.
Thanks again!
- Mark as New
- Bookmark
- Subscribe
- Mute
- Subscribe to RSS Feed
- Permalink
- Report Inappropriate Content
1. No. You can enable the legend to show the labels elsewhere or use the left function to truncate the labels.
2. Create a drilldown group with Subcategory and Customername and use that group as dimension instead of Subcategory.
talk is cheap, supply exceeds demand
- Mark as New
- Bookmark
- Subscribe
- Mute
- Subscribe to RSS Feed
- Permalink
- Report Inappropriate Content
Thank you so much for your prompt and spot-on help!
- Mark as New
- Bookmark
- Subscribe
- Mute
- Subscribe to RSS Feed
- Permalink
- Report Inappropriate Content
Hello,
I tried the Dual function, but couldnt get it to work! Im not managing to display the labels in the chart!
Could you please suggest?
Regards
- Mark as New
- Bookmark
- Subscribe
- Mute
- Subscribe to RSS Feed
- Permalink
- Report Inappropriate Content
Hi Gysbert,
Is it possible to display totals on top of 'Cats' , 'Dogs' , etc... when i pick 'show totals' it adds an entire box at the top, which i dont want. I would like to simply show a numeric value.
Thanks for your help.
Prashant