Unlock a world of possibilities! Login now and discover the exclusive benefits awaiting you.
- Qlik Community
- :
- All Forums
- :
- QlikView App Dev
- :
- Transpose Excel in script load
- Subscribe to RSS Feed
- Mark Topic as New
- Mark Topic as Read
- Float this Topic for Current User
- Bookmark
- Subscribe
- Mute
- Printer Friendly Page
- Mark as New
- Bookmark
- Subscribe
- Mute
- Subscribe to RSS Feed
- Permalink
- Report Inappropriate Content
Transpose Excel in script load
Hi Guys,
Hope someone can help, I am in the middle of loading Excel management reports into Qlikview,
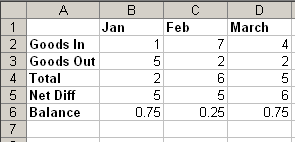
There are a few that are formatted incorrectly , at the moment they are formatted like FIG 2 , however I wish for them to be formatted as FIG 1 .
( Basically all the data Transposed !!) I dont really want to do this in Excel (as the management do not want their logs amended and I'm not really keen on building a mirror log to load)
Doen anyone know if Qlikview has some fancy script that may help ?
Thanks
A
FIG 1
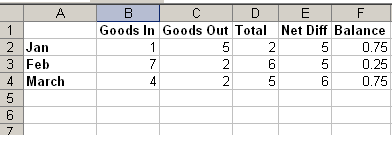
FIG 2
- Tags:
- new_to_qlikview
Accepted Solutions
- Mark as New
- Bookmark
- Subscribe
- Mute
- Subscribe to RSS Feed
- Permalink
- Report Inappropriate Content
HI,
Have a look at using the transformation step which is available on step 2 of the table wizard when doing the data load.
Thanks,
Sunil
Sunil Kenth
Pre-Sales Solutions Consultant
07557 267133
qlik.com<http://www.qlik.com/>
NOTICE: If received in error, please destroy and notify sender. Sender does not waive confidentiality or privilege, and use is prohibited. QlikTech UK Limited, registered in England and Wales with number 5292408, and whose registered office is Villiers House, Clarendon Avenue, Leamington Spa, Warwickshire, CV32 5PR.
- Mark as New
- Bookmark
- Subscribe
- Mute
- Subscribe to RSS Feed
- Permalink
- Report Inappropriate Content
Hello,
If I understand you right, a crosstable load would help, so the months are loaded as field month and its different values, column A is loaded as it is and values are loaded as values. Not tested, but the script should look like
Data:
CROSSTABLE (Type, Month, Values) LOAD *
FROM ExcelFile.xls (....);
Then in the new chart, you can pivot the types to be vertical at the top and so.
EDIT: By the way, transposing is available for QVD files as well (actually, for any table file), so you can load your excel files, store into QVD, then do the transposing when loading the QVDs. I don't see any particular advantage in this double step, but you may find it useful.
Hope that helps.
BI Consultant
- Mark as New
- Bookmark
- Subscribe
- Mute
- Subscribe to RSS Feed
- Permalink
- Report Inappropriate Content
Hi,
You can use the Cross Table Wizard to convert the tables outputs from Figure 2 to Figure 1 by which your columns would be converted to rows or vice versa.
Regards,
Raj Kishor
- Mark as New
- Bookmark
- Subscribe
- Mute
- Subscribe to RSS Feed
- Permalink
- Report Inappropriate Content
Thanks Guys
Both answers seem to work , going to flute around with data to see what model suits it best
Kind regards
Anne
- Mark as New
- Bookmark
- Subscribe
- Mute
- Subscribe to RSS Feed
- Permalink
- Report Inappropriate Content
Hi Guys
Just wondering on the Transpose ( using the file wizard) does anyone know how to select the data from the third row down ?
Thanks
- Mark as New
- Bookmark
- Subscribe
- Mute
- Subscribe to RSS Feed
- Permalink
- Report Inappropriate Content
Its ok figured it out Conditional delete
Thanks