Unlock a world of possibilities! Login now and discover the exclusive benefits awaiting you.
- Qlik Community
- :
- All Forums
- :
- QlikView App Dev
- :
- Trend Chart Using Date Range in a Set Analysis Exp...
- Subscribe to RSS Feed
- Mark Topic as New
- Mark Topic as Read
- Float this Topic for Current User
- Bookmark
- Subscribe
- Mute
- Printer Friendly Page
- Mark as New
- Bookmark
- Subscribe
- Mute
- Subscribe to RSS Feed
- Permalink
- Report Inappropriate Content
Trend Chart Using Date Range in a Set Analysis Expression
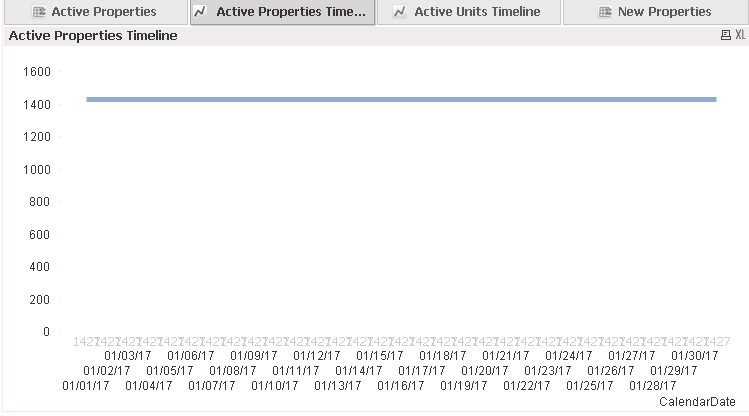
I am trying to create a trend line chart with CalendarDate as the dimension and a COUNT of Active Properties as the expression.
I had to use a set analysis expression in order to COUNT the number of active properties on a given day:
=COUNT({<BegDateOfOperation = {'<=$(=CalendarDate)'}, EndDateOfOperation = {'>$(=CalendarDate)'}>} %PropertyKey)
The problem is that all I get is either a straight line or a "No data to display" message when I try to create the chart. Attached is a screenshot. I would highly appreciate some advice.
Accepted Solutions
- Mark as New
- Bookmark
- Subscribe
- Mute
- Subscribe to RSS Feed
- Permalink
- Report Inappropriate Content
You need a RowKey that identifies each row uniquely for such intra record calculations or use IF()
Count(IF( BegDateOfOperation <= $(=CalendarDate) and EndDateOfOperation > $(=CalendarDate) , %PropertyKey))
OR
=COUNT({<RowKEY = {"=BegDateOfOperation <=$(CalendarDate) and EndDateOfOperation >$(CalendarDate)"} >} %PropertyKey)
Read this Post
If a post helps to resolve your issue, please accept it as a Solution.
- Mark as New
- Bookmark
- Subscribe
- Mute
- Subscribe to RSS Feed
- Permalink
- Report Inappropriate Content
try to use only aggregation function
=COUNT(%PropertyKey)
- Mark as New
- Bookmark
- Subscribe
- Mute
- Subscribe to RSS Feed
- Permalink
- Report Inappropriate Content
Will you be able to share a sample qvw??
- Mark as New
- Bookmark
- Subscribe
- Mute
- Subscribe to RSS Feed
- Permalink
- Report Inappropriate Content
You need a RowKey that identifies each row uniquely for such intra record calculations or use IF()
Count(IF( BegDateOfOperation <= $(=CalendarDate) and EndDateOfOperation > $(=CalendarDate) , %PropertyKey))
OR
=COUNT({<RowKEY = {"=BegDateOfOperation <=$(CalendarDate) and EndDateOfOperation >$(CalendarDate)"} >} %PropertyKey)
Read this Post
If a post helps to resolve your issue, please accept it as a Solution.