Unlock a world of possibilities! Login now and discover the exclusive benefits awaiting you.
- Qlik Community
- :
- All Forums
- :
- QlikView
- :
- Re: Two dimensional chart total values
- Subscribe to RSS Feed
- Mark Topic as New
- Mark Topic as Read
- Float this Topic for Current User
- Bookmark
- Subscribe
- Mute
- Printer Friendly Page
- Mark as New
- Bookmark
- Subscribe
- Mute
- Subscribe to RSS Feed
- Permalink
- Report Inappropriate Content
Two dimensional chart total values
Hello everybody,
I need help concerning chart, specifically its total column. The case is the following:
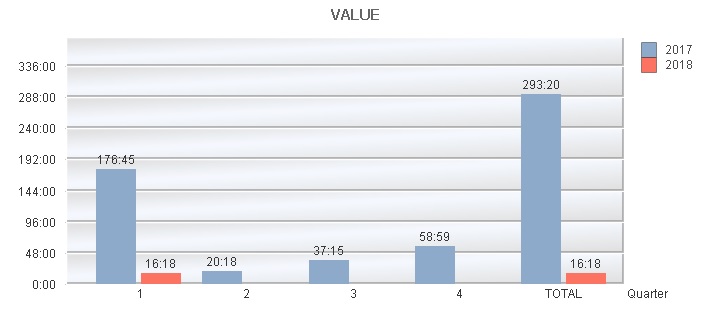
I have two dimensions - quarter and year and I have expression sum(value). I have ticked the 'show total' for quarter in "Dimension Limits" tab, but what I am getting is one total column. I need to have different TOTAL columns for different years. The picture below represents what I am getting now. Is it possible to have separate totals for different years?
Thank you very much in advance for your help.
Accepted Solutions
- Mark as New
- Bookmark
- Subscribe
- Mute
- Subscribe to RSS Feed
- Permalink
- Report Inappropriate Content
Hope it helps...!
- Mark as New
- Bookmark
- Subscribe
- Mute
- Subscribe to RSS Feed
- Permalink
- Report Inappropriate Content
If you want to show year wise total, i think you can go with Pivot table, in bar chart it will show to total for your entire dimension.
- Mark as New
- Bookmark
- Subscribe
- Mute
- Subscribe to RSS Feed
- Permalink
- Report Inappropriate Content
Use trellis chart. You can compare between multiple years as well.
- Mark as New
- Bookmark
- Subscribe
- Mute
- Subscribe to RSS Feed
- Permalink
- Report Inappropriate Content
Hope it helps...!
- Mark as New
- Bookmark
- Subscribe
- Mute
- Subscribe to RSS Feed
- Permalink
- Report Inappropriate Content
Thank you so much to all of you for your replies. They were very helpful for me as I am new to qlikview.
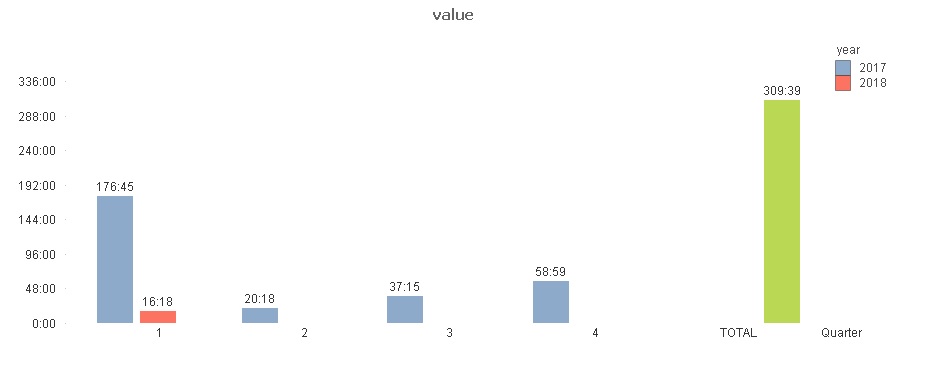
Raju, thanks for sharing your .qvw file. I wanted to have TOTALS at the end of the chart, not after each quarter, that's why I have modified it slightly (I deleted total from expressions and ticked the show total for quarter) and now it is exactly what I wanted. Thank you once again!