Unlock a world of possibilities! Login now and discover the exclusive benefits awaiting you.
- Qlik Community
- :
- All Forums
- :
- QlikView App Dev
- :
- US Heat Map Help
Options
- Subscribe to RSS Feed
- Mark Topic as New
- Mark Topic as Read
- Float this Topic for Current User
- Bookmark
- Subscribe
- Mute
- Printer Friendly Page
Turn on suggestions
Auto-suggest helps you quickly narrow down your search results by suggesting possible matches as you type.
Showing results for
Anonymous
Not applicable
2016-06-07
04:00 PM
- Mark as New
- Bookmark
- Subscribe
- Mute
- Subscribe to RSS Feed
- Permalink
- Report Inappropriate Content
US Heat Map Help
Hello,
Looking for the best expression to cover the following:
Looking at Variance in Claims from one year to the next. I want the higher positive numbers to show red, with the colors going towards white as they get smaller. Conversely, I want the negative numbers as they get smaller, to get more blue. Currently, my equation is:
If(Variance>0, LightRed(),
If(Variance<=0, Blue(),))
Any ideas on the best equation to get the smallest numbers to come in the most blue?
Here is my map currently:
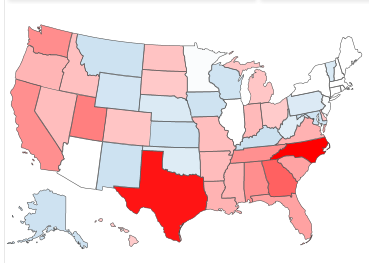
New York and the white states should be the darkest blue possible.
Thank you!
529 Views
0 Replies