Unlock a world of possibilities! Login now and discover the exclusive benefits awaiting you.
- Qlik Community
- :
- All Forums
- :
- QlikView App Dev
- :
- Underlining and Setting text to bold to portions o...
- Subscribe to RSS Feed
- Mark Topic as New
- Mark Topic as Read
- Float this Topic for Current User
- Bookmark
- Subscribe
- Mute
- Printer Friendly Page
- Mark as New
- Bookmark
- Subscribe
- Mute
- Subscribe to RSS Feed
- Permalink
- Report Inappropriate Content
Underlining and Setting text to bold to portions of the table chart
Hi -
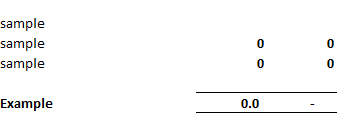
I am working on a table where i need to Bold/Underline my Totals.
I tried achieving that through 'Custom Form' option but the problem is that formatting applies to all rows for specific dimension. Where as I need to bold/underline only totals.
Any suggestions?
Thank you!
- Mark as New
- Bookmark
- Subscribe
- Mute
- Subscribe to RSS Feed
- Permalink
- Report Inappropriate Content
it looks like it working for me in a straight table.
See attached.
- Mark as New
- Bookmark
- Subscribe
- Mute
- Subscribe to RSS Feed
- Permalink
- Report Inappropriate Content
What if i need to apply the same logic to a value in cell D?
- Mark as New
- Bookmark
- Subscribe
- Mute
- Subscribe to RSS Feed
- Permalink
- Report Inappropriate Content
Other than the totals cell? A random value cell? Then it will apply to all rows as those are treated as being the same.
- Mark as New
- Bookmark
- Subscribe
- Mute
- Subscribe to RSS Feed
- Permalink
- Report Inappropriate Content
Yes, I am looking to apply this type of formatting to specific row. I am not calculating totals in QV, i am brining in this information for an excel file.

Is that possible with QlikView?
Thank you
Zhenya
- Mark as New
- Bookmark
- Subscribe
- Mute
- Subscribe to RSS Feed
- Permalink
- Report Inappropriate Content
If this comes from excel, then it has a dimension, maybe called Totals. try to set font in expression if dimension is totals
- Mark as New
- Bookmark
- Subscribe
- Mute
- Subscribe to RSS Feed
- Permalink
- Report Inappropriate Content
Hi,
If I understand your question well, you want to bold all TOTAL?
If you are using straight table (or any table), please go to Chart Property > Expressions then click the + sign beside the TOTAL > click Text Format > on the right hand side of the screen under Definition, enter TOTAL = 'B', I can't remember on top of my head if that has to be '<B>' or just 'B' but I think it is '<B>' and clik OK
Let me know if it worked
Regards,
Gabriel
- Mark as New
- Bookmark
- Subscribe
- Mute
- Subscribe to RSS Feed
- Permalink
- Report Inappropriate Content
Hi, I have modified above example.
You can assign condition in Text Format so if the value is 'D' then Make it bold, if it lowest value assign LightRed().
Try it.
- Mark as New
- Bookmark
- Subscribe
- Mute
- Subscribe to RSS Feed
- Permalink
- Report Inappropriate Content
That did not work for me. I need to bold specific Rows for example
2012 (measure)
Revenue
1
2
3
Cost of Goods Sold
1
2
3
Expense