Unlock a world of possibilities! Login now and discover the exclusive benefits awaiting you.
- Qlik Community
- :
- All Forums
- :
- QlikView App Dev
- :
- Re: Unknow expressions needed
- Subscribe to RSS Feed
- Mark Topic as New
- Mark Topic as Read
- Float this Topic for Current User
- Bookmark
- Subscribe
- Mute
- Printer Friendly Page
- Mark as New
- Bookmark
- Subscribe
- Mute
- Subscribe to RSS Feed
- Permalink
- Report Inappropriate Content
Unknow expressions needed
Hi,
I have a table with a multiple categories that could potentially have 1 to 100 accounts assiged per category.
I want to be able to list the categories and calculate the total dollars for each account.
My problem is that number of accounts can vary for each category and i don't have any idea how many expressions i would
need to create for every selection made.
I've assigned line numbers to each account and was going to list them as line number 1 = column 1, line number 2 = column 2,etc. and hide them if that account(line number) was zero. The problem is i would need 100 expressions and would need to add more if the number of accounts grows.
Is there a dynamic way to create expressions based on the number of accounts(lines numbers) found?
Thanks in advance.
- Mark as New
- Bookmark
- Subscribe
- Mute
- Subscribe to RSS Feed
- Permalink
- Report Inappropriate Content
Hi,
It would be interesting if you can attach some Data and the expected output via screen shots 
- Mark as New
- Bookmark
- Subscribe
- Mute
- Subscribe to RSS Feed
- Permalink
- Report Inappropriate Content
yap little more...
- Mark as New
- Bookmark
- Subscribe
- Mute
- Subscribe to RSS Feed
- Permalink
- Report Inappropriate Content
for location 220 table I have 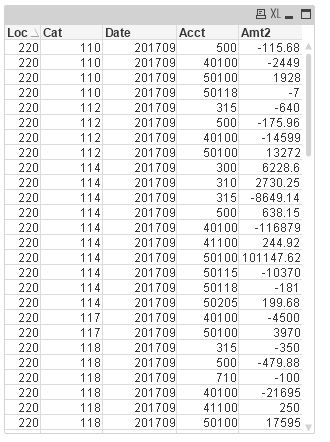
- 4 accounts for cat 110 (my Dimension) – 500,40100,50100,50118
- 3 accounts for cat 112 - 315,500,40100,50100
If I wanted to sum AMT2 based on category I would need (5) expressions
add category 114
- 10 accounts for cat 114 – 300,310,315,500,40100,41100,50100,50115,50118,50205
Now I need an additional (5) expressions.
Now I have (10) expressions – Is there a dynamic way to create the expression based on selection (in this case location 220)
- Mark as New
- Bookmark
- Subscribe
- Mute
- Subscribe to RSS Feed
- Permalink
- Report Inappropriate Content
i think you can try Pick(match(),) for that
- Mark as New
- Bookmark
- Subscribe
- Mute
- Subscribe to RSS Feed
- Permalink
- Report Inappropriate Content
Sum({<Cat = {'110'}>}Amt2) will not work for you?
- Mark as New
- Bookmark
- Subscribe
- Mute
- Subscribe to RSS Feed
- Permalink
- Report Inappropriate Content
Jahanzeb,
Can you give me an example of how i would implement this. I've never work with pick(match)
Thanks
- Mark as New
- Bookmark
- Subscribe
- Mute
- Subscribe to RSS Feed
- Permalink
- Report Inappropriate Content
I can understand you pain, You want to have separate column of sum for each account number and want to hide or show that column based on if whether account no is active or not at any given moment.
We resolved similar issue after migrating to Qlik Sense, mashups/hypercubes, now we are generating expressions dynamically in the script using island tables but I don't think its possible in Qlikview.
By any chance if you can use pivot table, you can make account number column horizontal, but the restrictions will be there as columns cannot be sorted.