Unlock a world of possibilities! Login now and discover the exclusive benefits awaiting you.
Announcements
Now accepting applications for the Qlik Luminary and Partner Ambassador Programs: Apply by July 6!
- Qlik Community
- :
- All Forums
- :
- QlikView
- :
- Unstack bar chart
Options
- Subscribe to RSS Feed
- Mark Topic as New
- Mark Topic as Read
- Float this Topic for Current User
- Bookmark
- Subscribe
- Mute
- Printer Friendly Page
Turn on suggestions
Auto-suggest helps you quickly narrow down your search results by suggesting possible matches as you type.
Showing results for
Master II
2016-11-10
08:04 AM
- Mark as New
- Bookmark
- Subscribe
- Mute
- Subscribe to RSS Feed
- Permalink
- Report Inappropriate Content
Unstack bar chart
Hi All,
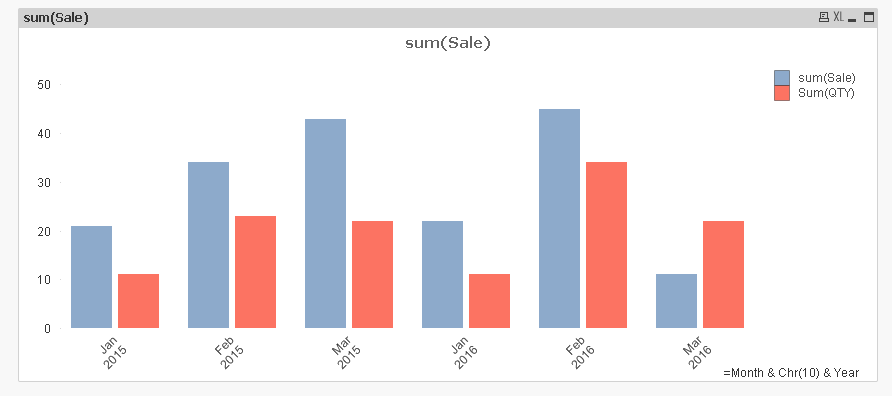
Is there any way to create a chart like below ? Normally it gets stacked.

Br,
KC
Best Regards,
KC
KC
1,288 Views
7 Replies
MVP
2016-11-10
08:09 AM
- Mark as New
- Bookmark
- Subscribe
- Mute
- Subscribe to RSS Feed
- Permalink
- Report Inappropriate Content
Try adding a third dimension (may be like a calculated dimension as 1) and see if that helps
1,145 Views
Master II
2016-11-10
08:11 AM
Author
- Mark as New
- Bookmark
- Subscribe
- Mute
- Subscribe to RSS Feed
- Permalink
- Report Inappropriate Content
No luck 
Best Regards,
KC
KC
1,145 Views
MVP
2016-11-10
08:13 AM
- Mark as New
- Bookmark
- Subscribe
- Mute
- Subscribe to RSS Feed
- Permalink
- Report Inappropriate Content
Would you be able to share your sample qvw
1,145 Views
Master II
2016-11-10
08:14 AM
Author
- Mark as New
- Bookmark
- Subscribe
- Mute
- Subscribe to RSS Feed
- Permalink
- Report Inappropriate Content
Sample attached.
Best Regards,
KC
KC
1,145 Views
Anonymous
Not applicable
2016-11-10
08:14 AM
- Mark as New
- Bookmark
- Subscribe
- Mute
- Subscribe to RSS Feed
- Permalink
- Report Inappropriate Content
If you take a look at chart properties > Style > Sub Type and select Grouped?
1,145 Views
MVP
2016-11-10
08:52 AM
- Mark as New
- Bookmark
- Subscribe
- Mute
- Subscribe to RSS Feed
- Permalink
- Report Inappropriate Content
I guess the only option I see is to combine your two dimension into one
=Month & Chr(10) & Year
Master II
2016-11-10
08:56 AM
Author
- Mark as New
- Bookmark
- Subscribe
- Mute
- Subscribe to RSS Feed
- Permalink
- Report Inappropriate Content
I already tried this  , it was silly that i never noticed this behavior in Qlikview.
Best Regards,
KC
KC
1,144 Views