Unlock a world of possibilities! Login now and discover the exclusive benefits awaiting you.
- Qlik Community
- :
- All Forums
- :
- QlikView App Dev
- :
- Urgent - Median line on scatter chart - need to pl...
- Subscribe to RSS Feed
- Mark Topic as New
- Mark Topic as Read
- Float this Topic for Current User
- Bookmark
- Subscribe
- Mute
- Printer Friendly Page
- Mark as New
- Bookmark
- Subscribe
- Mute
- Subscribe to RSS Feed
- Permalink
- Report Inappropriate Content
Urgent - Median line on scatter chart - need to plot based on each day
Hello team,
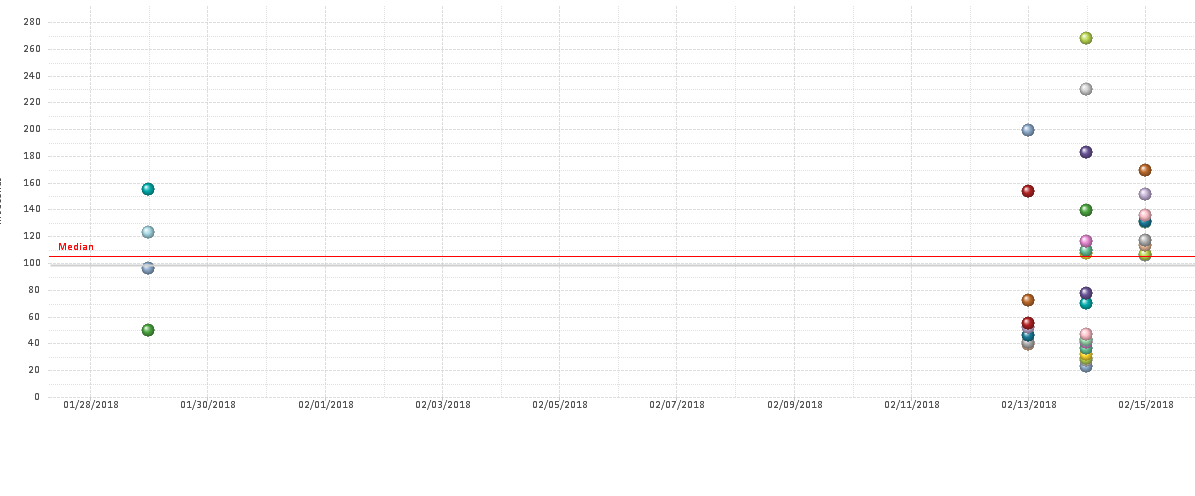
I am trying to show a Median in the below graph.
While searching older posts, I see that we can plot the Median using the reference line option in Presentation tab. (The line shown in Red below).
My requirement is, to show the daily median as well, instead of a straight horizontal line.
Basically, to find the median of each dots for a particular date and then plot them as well (along with existing dots).
Also to join these individual medians (based on daily value) and show the trend.
Can you please guide me.
If not possible directly via Scatter graph, if there are any workaround available to show the same. Even by modifying Edit Script?