Unlock a world of possibilities! Login now and discover the exclusive benefits awaiting you.
- Qlik Community
- :
- All Forums
- :
- QlikView App Dev
- :
- Using Block Graphic
- Subscribe to RSS Feed
- Mark Topic as New
- Mark Topic as Read
- Float this Topic for Current User
- Bookmark
- Subscribe
- Mute
- Printer Friendly Page
- Mark as New
- Bookmark
- Subscribe
- Mute
- Subscribe to RSS Feed
- Permalink
- Report Inappropriate Content
Using Block Graphic
Hello everyone,
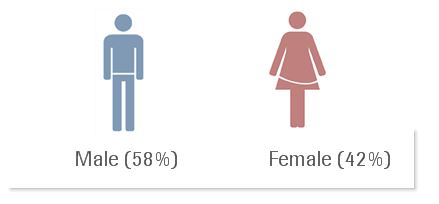
I am using a Block Graphic to show the gender of employees, but i am with a problem: it always shows the higher value in the left, as you can see below:
When i apply a filter, where Female is higher, it moves to the left hand side, as you can see below:
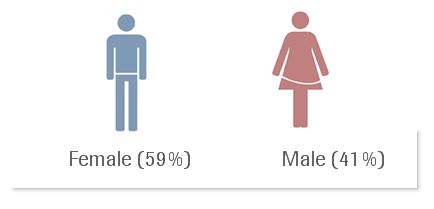
Is there a way that i can set the values always in the same position?
I need to show Male always in the left hand side, and Female always in the right hand side.
If is not possible, what type of graph should i use to do that?
Thanks,
Rodrigo
- Tags:
- new_to_qlikview
- Mark as New
- Bookmark
- Subscribe
- Mute
- Subscribe to RSS Feed
- Permalink
- Report Inappropriate Content
can you provide a sample qvw?
- Mark as New
- Bookmark
- Subscribe
- Mute
- Subscribe to RSS Feed
- Permalink
- Report Inappropriate Content
idea
you could possibly use set analysis and have 2 expressions - one for male and one for female
have 1 chart for each and palce accordingly
having a sample qvw will help
what about changing the sort to be Text, Z to A (diemsnion)
- Mark as New
- Bookmark
- Subscribe
- Mute
- Subscribe to RSS Feed
- Permalink
- Report Inappropriate Content
its the sorting issue:
Go to chart properties>Sort> un-check on the numeric value sort > have check on the Text>Z to A
- Mark as New
- Bookmark
- Subscribe
- Mute
- Subscribe to RSS Feed
- Permalink
- Report Inappropriate Content
I think Block Charts doesn't have the sorting tab in the Chart Properties.
At least i am not finding.
- Mark as New
- Bookmark
- Subscribe
- Mute
- Subscribe to RSS Feed
- Permalink
- Report Inappropriate Content
you are correct - what about 2 block charts side by side - using set analysis - one for male and one for female
or possibly 1 block chart with 2 expressions using set analysis - do not use block charts a lot myself
a sample qvw will help as well
- Mark as New
- Bookmark
- Subscribe
- Mute
- Subscribe to RSS Feed
- Permalink
- Report Inappropriate Content
Hi Adam,
Attached is the qvw and xls.
Thanks,
- Mark as New
- Bookmark
- Subscribe
- Mute
- Subscribe to RSS Feed
- Permalink
- Report Inappropriate Content
see updated version - made a copy of your block chart but display as a table and removed all of the lines - sorted from Z to A - you can then place your images above the table
this is one way to do it
did not look at all of the code so not sure how you are getting percent but set analysis for just male and then female can work as well
you can also do something similar using set analysis with text boxes and alsways having the male on the left and the images above
- Mark as New
- Bookmark
- Subscribe
- Mute
- Subscribe to RSS Feed
- Permalink
- Report Inappropriate Content
Rodrigo
since block charts can only ahve 1 expression, I suggest you look at something like the table method, text boxes, using set analysis to ensure that one expression will always have a male count and the other expression will have the female count