Unlock a world of possibilities! Login now and discover the exclusive benefits awaiting you.
- Qlik Community
- :
- All Forums
- :
- QlikView App Dev
- :
- Using Minicharts
- Subscribe to RSS Feed
- Mark Topic as New
- Mark Topic as Read
- Float this Topic for Current User
- Bookmark
- Subscribe
- Mute
- Printer Friendly Page
- Mark as New
- Bookmark
- Subscribe
- Mute
- Subscribe to RSS Feed
- Permalink
- Report Inappropriate Content
Using Minicharts
Hi,
I am new to qlikview and would want to get an insight on minicharts.I did try searching for the same but still could not get a better understanding on it. So can anyone please let me know when,why and under what circumstances we use minicharts,like i would want to know its complete usage and what kind of dimensions and expressions are much suited for the same.It would be very helpful if someone can provide the required information in abundance.Thanks in advance
- Tags:
- new_to_qlikview
- Mark as New
- Bookmark
- Subscribe
- Mute
- Subscribe to RSS Feed
- Permalink
- Report Inappropriate Content
It is to show monthly trend like thing embeded in a straight table
we used it like this 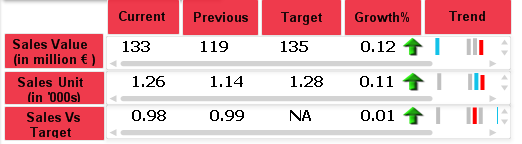
Here trend is the mini chart bar chart for the dimension months...
There different modes to use it Bar,Dots, Line with dot etc as per need.
- Mark as New
- Bookmark
- Subscribe
- Mute
- Subscribe to RSS Feed
- Permalink
- Report Inappropriate Content
Hi Anushree,
often when you want to represent a trend using a simple iconic indicator isn't the most effective way, because with that the user don't know which is the reference value: for example, the green arrow shows a growth relative to the previous month or the same month of the previous year?
The advantage of minichart is the rapid description of the storic process and the range of the changes relative to a temporal dimension chosen. These kind of charts are effective also for three visual reasons:
- horizon's metaphor: the eye is naturally able to investigate deviation from the horizon;
- easy of labeling: the reading is more simple 'from left to right' compared to 'from up to down'
- focus on relationship cause-effect: the values on y-axis represent the event to investigate