Unlock a world of possibilities! Login now and discover the exclusive benefits awaiting you.
- Qlik Community
- :
- All Forums
- :
- QlikView App Dev
- :
- Re: Using ValueList with Pick(Match(
- Subscribe to RSS Feed
- Mark Topic as New
- Mark Topic as Read
- Float this Topic for Current User
- Bookmark
- Subscribe
- Mute
- Printer Friendly Page
- Mark as New
- Bookmark
- Subscribe
- Mute
- Subscribe to RSS Feed
- Permalink
- Report Inappropriate Content
Using ValueList with Pick(Match(
Hi,
I am trying to create a graph from my existing data, but am having trouble in doing so. Here are the details.
I have a table that looks like this (not exactly, but the same idea for simplicity):
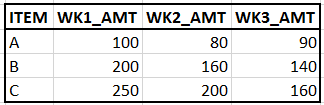
I am trying to create a line graph, that puts sum(WK1_AMT), sum(WK2_AMT), & sum(WK3_AMT) on the same trend line. Just like this:
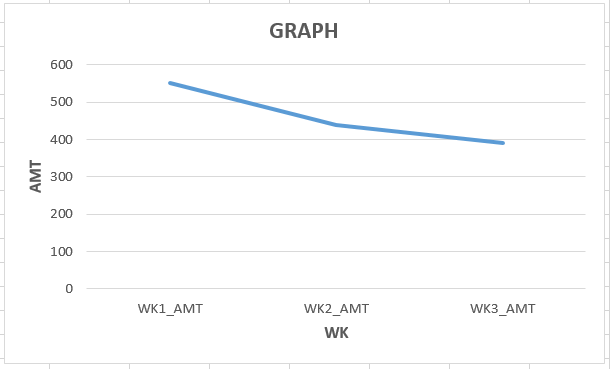
As you can tell, its not so simple, since each amount represents its own column header/expression. My idea, and this is where my question lies, is if I can utilize PICK(MATCH(VALUELIST... where I create a value list of something like ValueList('WK1','WK2','WK3').
Then, in my expression, write something like:
PICK(MATCH(VALUELIST('WK1','WK2','WK3'),'WK1','WK2','WK3'),
sum(WK1_AMT),
sum(WK2_AMT),
sum(WK3_AMT)
))
Essentially, what I am trying to do, is force a manually created dimension value, to an expression. Trying to do the above, my graph keeps saying "No Data to Display", so I'm not sure if I am just writing it incorrectly, or if this just cannot be done (I did already add =Valuelist('WK1','WK2','WK3') in the calculated dimension.
Any help with trying to create the above graph, from the existing table would be greatly appreciated. I'm sure a suggestion of utilizing a crosstable would come up, but there is actually a lot more data in my table that would make that complicated. The above table is a simple idea of what I have.
Thank you all
Accepted Solutions
- Mark as New
- Bookmark
- Subscribe
- Mute
- Subscribe to RSS Feed
- Permalink
- Report Inappropriate Content
- Mark as New
- Bookmark
- Subscribe
- Mute
- Subscribe to RSS Feed
- Permalink
- Report Inappropriate Content
Hi,
Instead of Pick and match you can try if statement
=if(ValueList('WK1_AMT','WK2_AMT','WK3_AMT')='WK1_AMT', Sum(WK1_AMT),
if(ValueList('WK1_AMT','WK2_AMT','WK3_AMT')='WK2_AMT', Sum(WK2_AMT),
if(ValueList('WK1_AMT','WK2_AMT','WK3_AMT')='WK3_AMT', Sum(WK3_AMT))))
Please refer the attached qvw file
Thanks,
Pooja
- Mark as New
- Bookmark
- Subscribe
- Mute
- Subscribe to RSS Feed
- Permalink
- Report Inappropriate Content
May be this:
=if(ValueList('WK1','WK2','WK3')='WK1', Sum(WK1_AMT),
if(ValueList('WK1','WK2','WK3')='WK2', Sum(WK2_AMT),
if(ValueList('WK1','WK2','WK3')='WK3', Sum(WK3_AMT),0)))
- Mark as New
- Bookmark
- Subscribe
- Mute
- Subscribe to RSS Feed
- Permalink
- Report Inappropriate Content
Hi,
Thanks for the response. However, I am trying to avoid using repeated IF statements, as because I have so much data in the table, it would really drag down the performance issues.
Any idea with a workaround on the IF statements?
Thank you
- Mark as New
- Bookmark
- Subscribe
- Mute
- Subscribe to RSS Feed
- Permalink
- Report Inappropriate Content
Hi,
PFA the app with pick-match used in expression.
Thanks,
RT
- Mark as New
- Bookmark
- Subscribe
- Mute
- Subscribe to RSS Feed
- Permalink
- Report Inappropriate Content
PICK(MATCH(VALUELIST('WK1','WK2','WK3'),'WK1','WK2','WK3'),
sum(WK1_AMT),
sum(WK2_AMT),
sum(WK3_AMT)
))
I extra parentheses closing
- Mark as New
- Bookmark
- Subscribe
- Mute
- Subscribe to RSS Feed
- Permalink
- Report Inappropriate Content
This is it. Thank you!