Unlock a world of possibilities! Login now and discover the exclusive benefits awaiting you.
- Qlik Community
- :
- All Forums
- :
- QlikView App Dev
- :
- Using above function in Bar/Line Chart
- Subscribe to RSS Feed
- Mark Topic as New
- Mark Topic as Read
- Float this Topic for Current User
- Bookmark
- Subscribe
- Mute
- Printer Friendly Page
- Mark as New
- Bookmark
- Subscribe
- Mute
- Subscribe to RSS Feed
- Permalink
- Report Inappropriate Content
Using above function in Bar/Line Chart
Hi,
PFB Screenshot on which my complete development is based:-
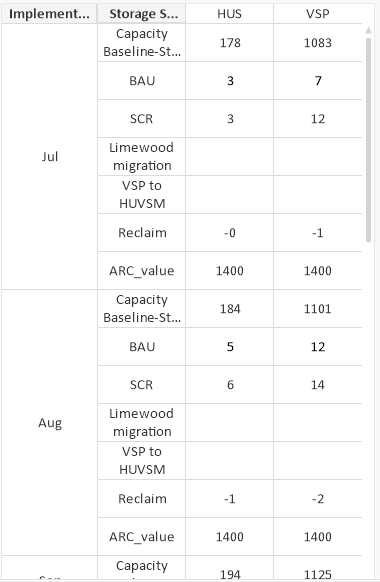
In the above table,i am using 2 dimensions-Month and StorageType(HUS or VSP), others are expressions.
Expression 1 uses a above function with complete expression:-
if(month ='Jul',if(storage_type='VSP','1083','178'),
above([Capacity Baseline-Storage])+above(BAU)+above(SCR)+ above(Reclaim))
This gives perfect result as shown in the above table.
BUT, when the same table is converted to a Bar/Line chart, it gives me only the first (default 'hard coded' value for the month of july).
PFB Screenshot:-
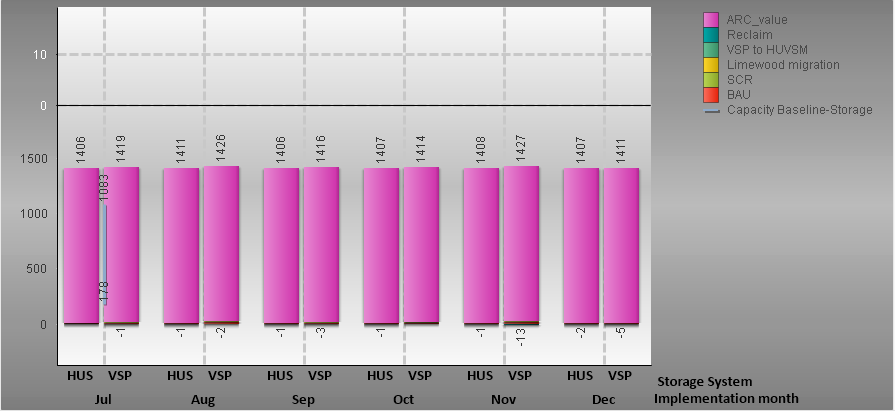
How can i get same figures in this chart as were coming in pivot table.
What extra do we have to use in the expression.
- Mark as New
- Bookmark
- Subscribe
- Mute
- Subscribe to RSS Feed
- Permalink
- Report Inappropriate Content
Have i made the requirement clear guys?
i request urgent help in this matter.