Unlock a world of possibilities! Login now and discover the exclusive benefits awaiting you.
- Qlik Community
- :
- All Forums
- :
- QlikView App Dev
- :
- Using multiple fields in a pie chart
- Subscribe to RSS Feed
- Mark Topic as New
- Mark Topic as Read
- Float this Topic for Current User
- Bookmark
- Subscribe
- Mute
- Printer Friendly Page
- Mark as New
- Bookmark
- Subscribe
- Mute
- Subscribe to RSS Feed
- Permalink
- Report Inappropriate Content
Using multiple fields in a pie chart
Hello everyone,
I am trying to create a pie chart that shows the sum of each Generation by Area:
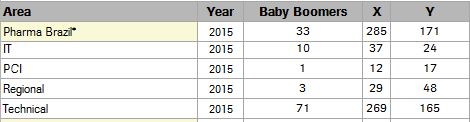
I need to creat a pie chart for each Area, so the first one will display the values of Baby Boomers, X and Y for "IT" and so go on.
I have created "Area" as the Dimension, and included 3 expressions:
sum ({<[Area]={IT}>}[Baby Boomers])
sum ({<[Area]={IT}>}X)
sum ({<[Area]={IT}>}Y)
And thats the result i had:
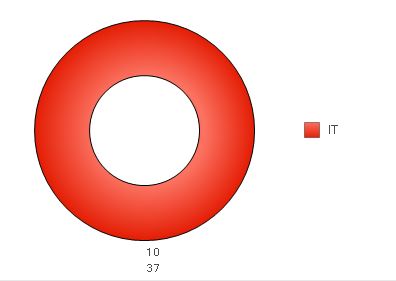
How can i show the values of each Generation in the same pie chart??
Thanks
- Tags:
- new_to_qlikview
Accepted Solutions
- Mark as New
- Bookmark
- Subscribe
- Mute
- Subscribe to RSS Feed
- Permalink
- Report Inappropriate Content
Remove the dimension.
- Mark as New
- Bookmark
- Subscribe
- Mute
- Subscribe to RSS Feed
- Permalink
- Report Inappropriate Content
Remove the dimension.
- Mark as New
- Bookmark
- Subscribe
- Mute
- Subscribe to RSS Feed
- Permalink
- Report Inappropriate Content
I don´t believe it was only that. (lol)
Thanks swuehl
- Mark as New
- Bookmark
- Subscribe
- Mute
- Subscribe to RSS Feed
- Permalink
- Report Inappropriate Content
Alternatively, load your data like
CROSSTABLE ( Generation, Value,2)
LOAD Area, Year, [Baby Boomers], X, Y
FROM ...;
Then create a pie chart (if you want...) with two dimensions, Area and Generation, select Trellis option for first dimension.
Use a single expression:
=Sum( Value)
- Mark as New
- Bookmark
- Subscribe
- Mute
- Subscribe to RSS Feed
- Permalink
- Report Inappropriate Content
Hi swuehl,
Please, could you clarify why you included "Value" and "2" into the Crosstable parameters?
CROSSTABLE ( Generation, Value,2)
Thanks
- Mark as New
- Bookmark
- Subscribe
- Mute
- Subscribe to RSS Feed
- Permalink
- Report Inappropriate Content
"Value" is the name of the field that will be generated by the transformation to hold the values (i.e. the number currently contained in fields Baby Boomers, X, Y). "Generation" will be the field that holds the generation values: "Baby Boomers", "X", "Y"). "2" is telling QV to handle first two fields in the LOAD statement as qualifying fields.
See also the HELP and
- Mark as New
- Bookmark
- Subscribe
- Mute
- Subscribe to RSS Feed
- Permalink
- Report Inappropriate Content
Hi swuehl,
Thanks a lot for your help.
It worked fine, but now i have other problem:
As you can see the data table above, there is a field Year, where i created a list to filter the results by Year.
I am using a single expression now:
sum({<[Area]={[Farma Brazil*]}>}Value)
With this expression in the pie chart, the list of the year is no filtering the results.
Do you know if it is possible to fix that?
Thanks
- Mark as New
- Bookmark
- Subscribe
- Mute
- Subscribe to RSS Feed
- Permalink
- Report Inappropriate Content
Yes, should be possible. But it's unclear how your current model looks like and what's causing the issue.
Could you upload a small sample QVW?
- Mark as New
- Bookmark
- Subscribe
- Mute
- Subscribe to RSS Feed
- Permalink
- Report Inappropriate Content
I have found where it was the issue.
I remaned the fields in the CrossTable, when i changed to the same name of the original fields the chart is filtering the results by year.
Thanks again swuehl.
- Mark as New
- Bookmark
- Subscribe
- Mute
- Subscribe to RSS Feed
- Permalink
- Report Inappropriate Content
Bot now i have synthetic keys as i have two tables with the same fields name.
