Unlock a world of possibilities! Login now and discover the exclusive benefits awaiting you.
- Qlik Community
- :
- All Forums
- :
- QlikView App Dev
- :
- Using "if" in an expression : how to have distinct...
- Subscribe to RSS Feed
- Mark Topic as New
- Mark Topic as Read
- Float this Topic for Current User
- Bookmark
- Subscribe
- Mute
- Printer Friendly Page
- Mark as New
- Bookmark
- Subscribe
- Mute
- Subscribe to RSS Feed
- Permalink
- Report Inappropriate Content
Using "if" in an expression : how to have distinct values ?
Good day,
I have the following data :
Data:
LOAD * INLINE [
Country, City, Value
France, Paris, 1
France, Lyon, 2
USA, Washington, 4
USA, New York, 8
Japan, Tokyo, 16
];
I'm using a separate table to manage geography :
Geography:
LOAD DISTINCT
Country AS Country_dim,
City AS City_dim
RESIDENT Data;
When I do a simple graph using the "Country" dimension, I have the following correct result :
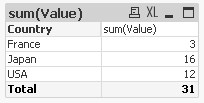
with a "sum(Value)" formula.
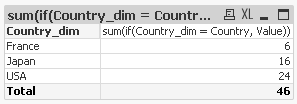
When I do more complex graphics, I need to use the "Country_dim" dimension as graph dimension (instead of "Country"), using a "if" in my expression
sum(if(Country_dim = Country, Value))
Because "Country_dim" have a frequency > 1, I have the wrong values :
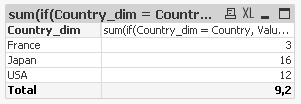
The solution I found is to make a division :
sum(if(Country_dim = Country, Value))
/
count(Country_dim)
but my total goes wrong :
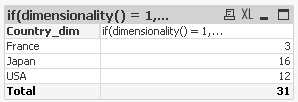
So, I'm using a more complex formula as workaround :
if(dimensionality() = 1,
sum(if(Country_dim = Country, Value))
/
count(Country_dim),
if(dimensionality() = 0,
sum(Value)
)
)
that gives me the expected result :
BUT, this workaround can give me very very complex formulas when I have to use many dimensions, and this formulas can be very very long to compute (because the "if" make a calculation of every pieces of formula).
Is there a way to say "I want to make my test on the distinct values of Country_dim" ?
I hoped that "sum(if(only(Country_dim) = Country, Value))" would work, but it doesn't.
- « Previous Replies
-
- 1
- 2
- Next Replies »
- Mark as New
- Bookmark
- Subscribe
- Mute
- Subscribe to RSS Feed
- Permalink
- Report Inappropriate Content
Chris Abwat-Johnson a écrit:
I've attached the qvd I have amended. I have only made changes in the script, I have not made any changes to the formula you have used.
Unfortunately, your solution give up the relation between the dimensions.
If I want to display a graph with 2 dimensions, if I don't check "suppress zero values", I have the following result :
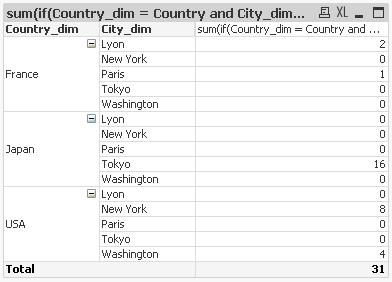
Yes, I could check the "suppress zero values", but when I will have a formula that doesn't return "null" or "0", I will have all my cities in every country. This is not OK for me.
With your solution, I have to add another test in my expression to check if the City_dim have to be in relation with the current Country_dim.
- Mark as New
- Bookmark
- Subscribe
- Mute
- Subscribe to RSS Feed
- Permalink
- Report Inappropriate Content
I've added this bit of code to the end of the script:
left Join (Geography_City) LOAD
City as City_dim,
Country as Country_dim
resident Data;
It is putting the country code into the Geography_City table to make a relation between the Geography_City and Geography_Country tables.
I can then re-check the Supress Zero Values.
Not sure if this will get a bit complicated though when you start adding more dimensions...
Regards,
Chris
- Mark as New
- Bookmark
- Subscribe
- Mute
- Subscribe to RSS Feed
- Permalink
- Report Inappropriate Content
Chris Abwat-Johnson a écrit:
I've added this bit of code to the end of the script:
left Join (Geography_City) LOAD
City as City_dim,
Country as Country_dim
resident Data;
This gives the same result as my first post : some "Country_dim" have a frequency > 1.
- Mark as New
- Bookmark
- Subscribe
- Mute
- Subscribe to RSS Feed
- Permalink
- Report Inappropriate Content
Hi,
Yes, that's right. DISTINCT in Sum() will distinguish any value regardless its source, hence I mentioned that was not a good idea. Anyway, you need conditionals since you are working row by row, and set analysis is evaluated once and for the whole chart (and not value by value), so according to your data the following will work
Sum(If(Country = Country_dim AND City = City_dim, Value))
Because you are taking all possible dimensions in the expresion (getting to the lower possible level of detail for the model provided). When you select a country in your Country listbox, the results with this expression will be fine, and the grand total will show the proper value as well. But you will need to add any other possible dimension in the left part of the condition with AND, so it still may take a lot to render, depending on the number of records. Actually, I'd dare say that not having the tables linked (which is not possible in your case) will never perform as if they were, because the conditional forces to compare row by row each possible value of the dimensions used in the chart.
Hope that makes sense.
BI Consultant
- Mark as New
- Bookmark
- Subscribe
- Mute
- Subscribe to RSS Feed
- Permalink
- Report Inappropriate Content
Hello,
Adding further to your query, I was wondering why can you to something like
If(Country = Country_dim AND City = City_dim, sum(Value))
or
IF(Country = Country_dim, sum(Value))
Please correct me if I am wrong here.
- Mark as New
- Bookmark
- Subscribe
- Mute
- Subscribe to RSS Feed
- Permalink
- Report Inappropriate Content
This cannot work.
You aks "if the dimension Coutry equals the dimension Coutry_dim, then give me the sum of all Values".
"Country" is not equal to "Country_dim", so your condition is never true.
If it was, "sum(Value)" would return the sum of all values.
- Mark as New
- Bookmark
- Subscribe
- Mute
- Subscribe to RSS Feed
- Permalink
- Report Inappropriate Content
Did you try using the conditional within instead? I've posted above about that.
BI Consultant
- Mark as New
- Bookmark
- Subscribe
- Mute
- Subscribe to RSS Feed
- Permalink
- Report Inappropriate Content
Miguel Angel Baeyens a écrit:
Did you try using the conditional within instead? I've posted above about that.
Yes, I have.
And your conclusions are the same that my statement : this can be very long to compute if I have many dimensions / many values.
I tried with a huge quantity of data and my conclusion is that
sum(if(Country_dim = Country, Value))
/
count(Country_dim)
is faster than
sum(if(Country_dim = Country and City_dim = City and Street_dim = Street, Value))
That's weird...
- « Previous Replies
-
- 1
- 2
- Next Replies »