Unlock a world of possibilities! Login now and discover the exclusive benefits awaiting you.
- Qlik Community
- :
- All Forums
- :
- QlikView App Dev
- :
- Value at date, Value Year -1 and Value Month -1
Options
- Subscribe to RSS Feed
- Mark Topic as New
- Mark Topic as Read
- Float this Topic for Current User
- Bookmark
- Subscribe
- Mute
- Printer Friendly Page
Turn on suggestions
Auto-suggest helps you quickly narrow down your search results by suggesting possible matches as you type.
Showing results for
Creator II
2015-09-29
08:24 AM
- Mark as New
- Bookmark
- Subscribe
- Mute
- Subscribe to RSS Feed
- Permalink
- Report Inappropriate Content
Value at date, Value Year -1 and Value Month -1
Dear All,
I have a test database showing 3 informations :
Data
Part number
Value
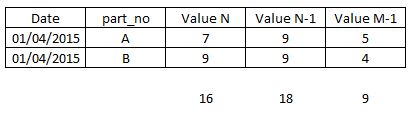
I need to sum up in a chart (for a selected period) the value for each part number, the value for this part number at year -1 and the value for this part number at month -1.
For instance, if i do select April 2015 :
Knowing the database is :
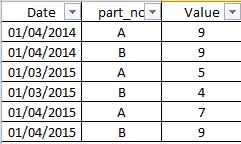
the outcome should be the following...
... although what i come to is :
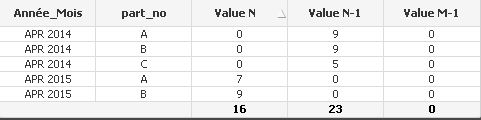
Several problems then :
- i don't want to see part number C in the chart as there is no value for C in April 2015 (the period selected)
- I need to see in the same raw the value for N and N-1 and not on separate ones
- Value for M-1 is not working at all
qvw and excel test database attached for the ones who want to help
Thanks in advance
344 Views
1 Reply
Creator II
2015-10-06
04:20 AM
Author
- Mark as New
- Bookmark
- Subscribe
- Mute
- Subscribe to RSS Feed
- Permalink
- Report Inappropriate Content
Any clue ?
273 Views