Unlock a world of possibilities! Login now and discover the exclusive benefits awaiting you.
- Qlik Community
- :
- All Forums
- :
- QlikView App Dev
- :
- Values on Data Point disappear
- Subscribe to RSS Feed
- Mark Topic as New
- Mark Topic as Read
- Float this Topic for Current User
- Bookmark
- Subscribe
- Mute
- Printer Friendly Page
- Mark as New
- Bookmark
- Subscribe
- Mute
- Subscribe to RSS Feed
- Permalink
- Report Inappropriate Content
Values on Data Point disappear
Hi all
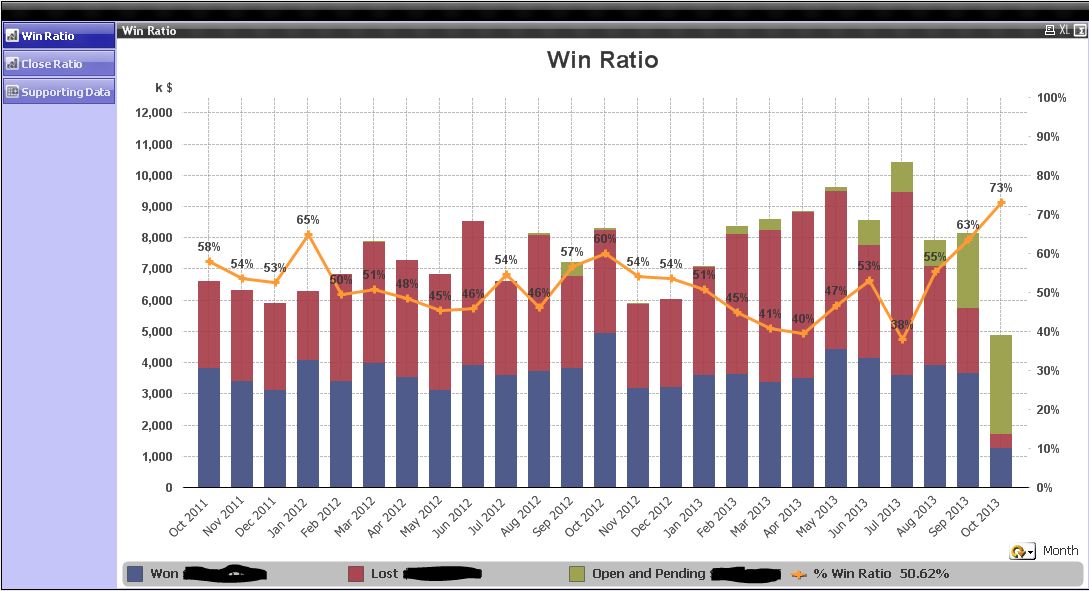
I have two charts in a container. The "Values On Data Points" is checked on only one of 4 expressions and the "Plot Values Inside Segments" is checked as well. "Max Values Shown" is set to 100.
The Dimension is Rolling Months
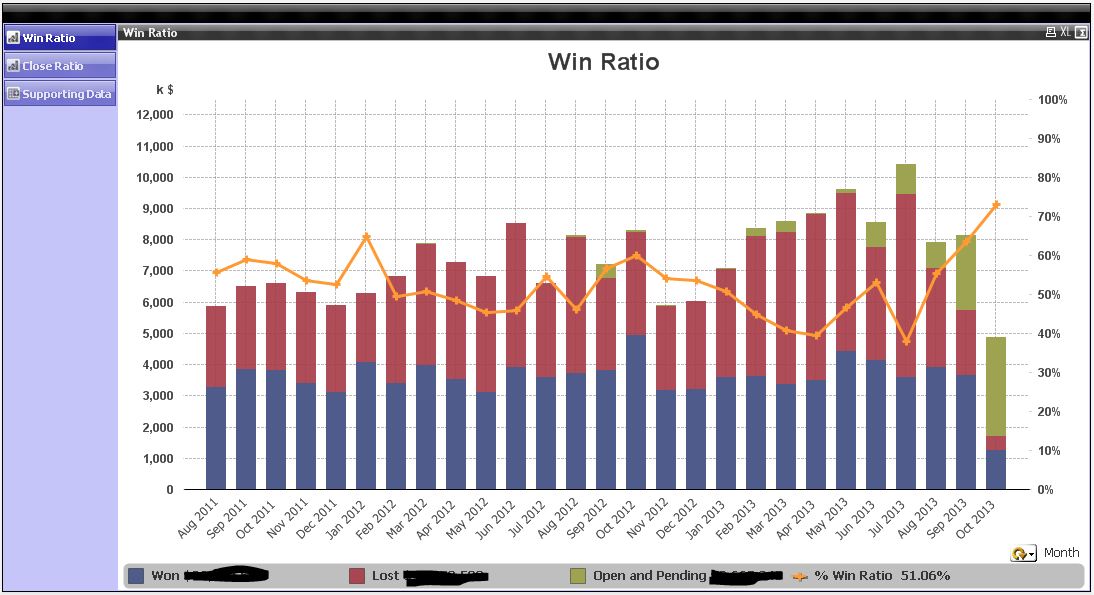
When selecting 1 and up to 25 months the Values show on the Data Points. However when selecting more than 25 months the Values disappear.
Am I missing any setting that cause that?
Thanks
Here Values show in this image (25 months selected)
And here Values disappear (27 months selected)
- Tags:
- new_to_qlikview
Accepted Solutions
- Mark as New
- Bookmark
- Subscribe
- Mute
- Subscribe to RSS Feed
- Permalink
- Report Inappropriate Content
Just guessing: did you try increasing ""Max Values Shown"?
Because 4 expressions x 27 months is bigger than 100
- Mark as New
- Bookmark
- Subscribe
- Mute
- Subscribe to RSS Feed
- Permalink
- Report Inappropriate Content
Set a smaller font at "Font" tab.
- Mark as New
- Bookmark
- Subscribe
- Mute
- Subscribe to RSS Feed
- Permalink
- Report Inappropriate Content
Did not help.
Sorry
Thanks though.
- Mark as New
- Bookmark
- Subscribe
- Mute
- Subscribe to RSS Feed
- Permalink
- Report Inappropriate Content
Is there any set analysis in your expression?
- Mark as New
- Bookmark
- Subscribe
- Mute
- Subscribe to RSS Feed
- Permalink
- Report Inappropriate Content
Just guessing: did you try increasing ""Max Values Shown"?
Because 4 expressions x 27 months is bigger than 100
- Mark as New
- Bookmark
- Subscribe
- Mute
- Subscribe to RSS Feed
- Permalink
- Report Inappropriate Content
Yes.
Thanks
- Mark as New
- Bookmark
- Subscribe
- Mute
- Subscribe to RSS Feed
- Permalink
- Report Inappropriate Content
WOW
You are so smart and observant!!!
Changed to 150 and it works.
Thanks a lot