Unlock a world of possibilities! Login now and discover the exclusive benefits awaiting you.
- Qlik Community
- :
- All Forums
- :
- QlikView App Dev
- :
- Values on data point
- Subscribe to RSS Feed
- Mark Topic as New
- Mark Topic as Read
- Float this Topic for Current User
- Bookmark
- Subscribe
- Mute
- Printer Friendly Page
- Mark as New
- Bookmark
- Subscribe
- Mute
- Subscribe to RSS Feed
- Permalink
- Report Inappropriate Content
Values on data point
Hi All,
In chart, we have option "Values on data point" in expression tab which shown values for each dimension.
Is there any chance we can display these values for specific dimensions?
I have two dimensions with one expression. Example
Data: Jan 2015 to This month
Chart: Line chart
Dim: Month and Year
Exp: Sum(Sales)
Now, 3 Lines shows 2015,2016 and 2017 from Jan-Dec as first dimension.
Can we show values only for 2017 line? Is it possible?
Thank you.
- Mark as New
- Bookmark
- Subscribe
- Mute
- Subscribe to RSS Feed
- Permalink
- Report Inappropriate Content
May be set in expression like expand + and then write this condition and remind you may be UN-check value on data points on Expression point.
If(Year = '2017', 1, Sum(Sales))
- Mark as New
- Bookmark
- Subscribe
- Mute
- Subscribe to RSS Feed
- Permalink
- Report Inappropriate Content
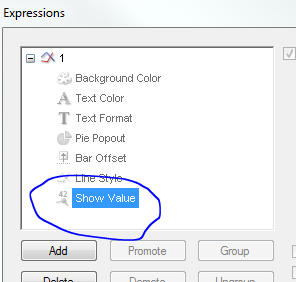
May be use an if statement to show the values for year 2017 under Show Value on the expressions tab
Year = 2017
- Mark as New
- Bookmark
- Subscribe
- Mute
- Subscribe to RSS Feed
- Permalink
- Report Inappropriate Content
Thank you Sunny and Anil.