Unlock a world of possibilities! Login now and discover the exclusive benefits awaiting you.
- Qlik Community
- :
- All Forums
- :
- QlikView App Dev
- :
- Variables behind a button
- Subscribe to RSS Feed
- Mark Topic as New
- Mark Topic as Read
- Float this Topic for Current User
- Bookmark
- Subscribe
- Mute
- Printer Friendly Page
- Mark as New
- Bookmark
- Subscribe
- Mute
- Subscribe to RSS Feed
- Permalink
- Report Inappropriate Content
Variables behind a button
Hoping someone can help.
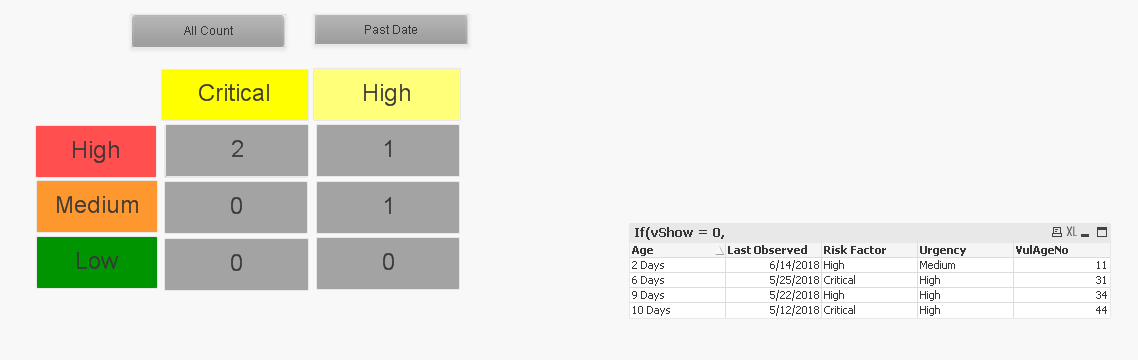
In the attached example, how do i get it that when the past date button is selected that the table on the right reflects to just show those that fall within the criteria of the variables behind the text boxes.
Thanks.
- « Previous Replies
-
- 1
- 2
- Next Replies »
Accepted Solutions
- Mark as New
- Bookmark
- Subscribe
- Mute
- Subscribe to RSS Feed
- Permalink
- Report Inappropriate Content
- Mark as New
- Bookmark
- Subscribe
- Mute
- Subscribe to RSS Feed
- Permalink
- Report Inappropriate Content
1) The chart on the right is a table box, you want to do this in table box or straight table is also okay?
2) So, when I select Past Date, I see a total count of 4 across the 6 text boxes.. is the expectation to see only 4 rows which meet the criteria?
- Mark as New
- Bookmark
- Subscribe
- Mute
- Subscribe to RSS Feed
- Permalink
- Report Inappropriate Content
Hi,
You're using a TableBox, it's parameters are limited. could you use a simple table instead? if so, then you could use different expressions that look like your variable expressions (with a conditional display)
- Mark as New
- Bookmark
- Subscribe
- Mute
- Subscribe to RSS Feed
- Permalink
- Report Inappropriate Content
Either Table box or straight table would be useful.
Yes, I would expect to only see those four lines as the output
- Mark as New
- Bookmark
- Subscribe
- Mute
- Subscribe to RSS Feed
- Permalink
- Report Inappropriate Content
Please find attached
- Mark as New
- Bookmark
- Subscribe
- Mute
- Subscribe to RSS Feed
- Permalink
- Report Inappropriate Content
This is what I am looking for! Thank you.
How would this work is a chart already has another expression though? I have a chart with Owner name, then a count expression, but the expression is just outputting the same on every row?

- Mark as New
- Bookmark
- Subscribe
- Mute
- Subscribe to RSS Feed
- Permalink
- Report Inappropriate Content
That is because you have stored your variable with an '=' sign. Remove the '=' sign from your variables 
- Mark as New
- Bookmark
- Subscribe
- Mute
- Subscribe to RSS Feed
- Permalink
- Report Inappropriate Content
Thank you so much!
- Mark as New
- Bookmark
- Subscribe
- Mute
- Subscribe to RSS Feed
- Permalink
- Report Inappropriate Content
No problem at all... please close the thread by marking correct and helpful response if you got what you wanted.
Best,
Sunny
- Mark as New
- Bookmark
- Subscribe
- Mute
- Subscribe to RSS Feed
- Permalink
- Report Inappropriate Content
I have noticed that the expression is not working as I would like. I believe it is because of the range sum. It is adding all of the records.
e.g. Jef with an urgency of Medium &risk Factor High should be 8 but it is 22.
I tried a RangeCount instead but this also did not work.
- « Previous Replies
-
- 1
- 2
- Next Replies »