Unlock a world of possibilities! Login now and discover the exclusive benefits awaiting you.
- Qlik Community
- :
- All Forums
- :
- QlikView App Dev
- :
- Vertical trendline to y-axis with no numeric x-axe...
- Subscribe to RSS Feed
- Mark Topic as New
- Mark Topic as Read
- Float this Topic for Current User
- Bookmark
- Subscribe
- Mute
- Printer Friendly Page
- Mark as New
- Bookmark
- Subscribe
- Mute
- Subscribe to RSS Feed
- Permalink
- Report Inappropriate Content
Vertical trendline to y-axis with no numeric x-axes
Good morning community,
I have been trying to implement some trendlines within my chart for hours and hours right now. I also do not know if it is possible at all.
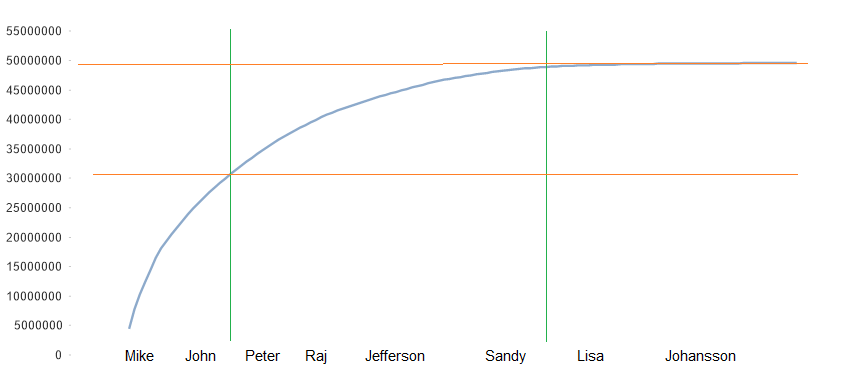
My chart includes a typical sales-to customers chart as aggregation. Therefore I put some example customer names along the x-axis, what makes it difficult to set a vertical trendline on.
The picture shows you the graph (blue) and manually implemented trendlines (orange, green). That is how my chart should look like.
Could anyone give me an advise how to solv this issue?
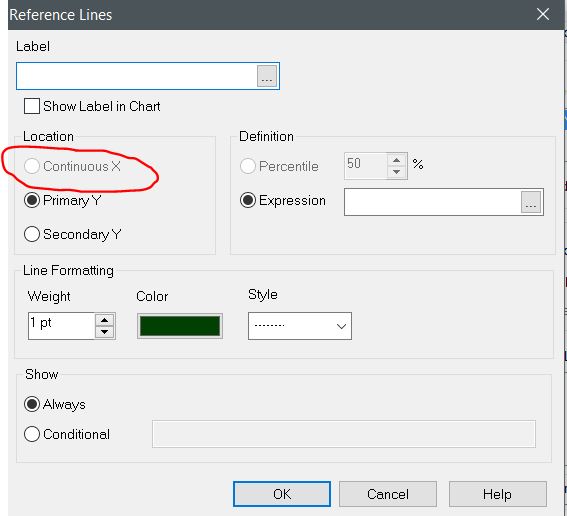
Just as note: I am not able to choose 'Continuous X' for sure.
Thank you in advance!
- Mark as New
- Bookmark
- Subscribe
- Mute
- Subscribe to RSS Feed
- Permalink
- Report Inappropriate Content
That option is only available if you select Continuous on the Axis tab of the chart properties