Unlock a world of possibilities! Login now and discover the exclusive benefits awaiting you.
- Qlik Community
- :
- All Forums
- :
- QlikView App Dev
- :
- Visual Cues
- Subscribe to RSS Feed
- Mark Topic as New
- Mark Topic as Read
- Float this Topic for Current User
- Bookmark
- Subscribe
- Mute
- Printer Friendly Page
- Mark as New
- Bookmark
- Subscribe
- Mute
- Subscribe to RSS Feed
- Permalink
- Report Inappropriate Content
Visual Cues
Hello,
I have a pivot table which looks something like below .
MeasureType MeasureName Variance
Revenue Sales 200
Expense COGS -19
Expense Var Exp -30
Revenue Marg Contribution 140
Expense Fixed OH 30
Expense Marketing -140
Revenue Profit -20
I want to use Visual Cues in the Variance column. The Red or Green colour is not only dependent on whether the Variance is a positive or negative number but also if the MeasureType is an Revenue or Expense item.
How can I use visual cues, to write an expression like :
If(AND(MeasureType=Revenue,Variance>=0, green(),If(AND(MeasureType=Revenue,Variance<0, red(), etc.
Appreciate any help.
Thanks.
Jay
- Mark as New
- Bookmark
- Subscribe
- Mute
- Subscribe to RSS Feed
- Permalink
- Report Inappropriate Content
You don't want to do it in Visual Cues. Instead, click on the plus sign next to your Variance expression. In background color, you can put something like:
if(MeasureType='Revenue' and Variance>=0, green(),
if(MeasureType='Revenue' and Variance<0, red()))
- Mark as New
- Bookmark
- Subscribe
- Mute
- Subscribe to RSS Feed
- Permalink
- Report Inappropriate Content
You can certainly use expressions, but it might be easier to use the Visual Cues native to QlikView. Navigate to the chart/table Properties, go to the Visual Cues tab, click on the Variance expression and enter your threshold numbers for the Upper and Lower values and set the desired colors.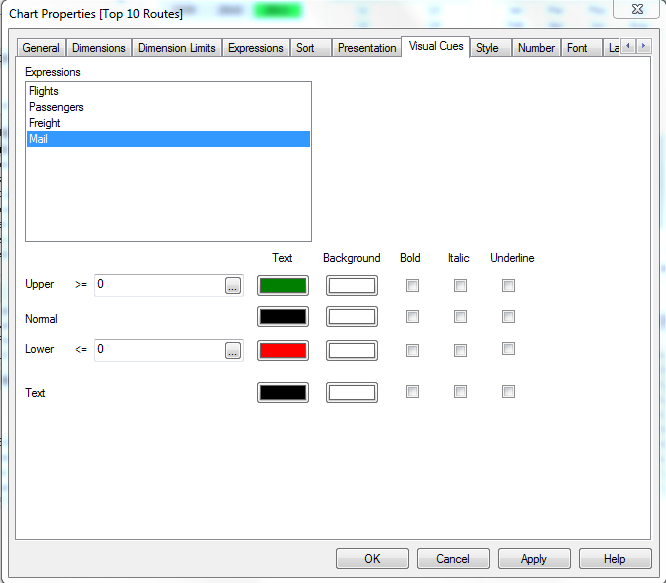
- Mark as New
- Bookmark
- Subscribe
- Mute
- Subscribe to RSS Feed
- Permalink
- Report Inappropriate Content
Sorry, can't seem to delete the reply, but my suggestion would work on one variable, I realized after I posted that you needed to account for 2 variables. Nicole's recommendation is correct.
- Mark as New
- Bookmark
- Subscribe
- Mute
- Subscribe to RSS Feed
- Permalink
- Report Inappropriate Content
Thanks Nicole.
I used :
(MeasureType='Revenue' and [Var : 2014 Act v Plan]>=0, Green(),
if(MeasureType='Revenue' and [Var : 2014 Act v Plan]<0, Red(),
if(MeasureType='Expense' and [Var : 2014 Act v Plan]>=0, Red(),
if(MeasureType='Expense' and [Var : 2014 Act v Plan]<0, Green()))))
The Variance column is not just one but 12 of them for each MonthID.
The above expresion seems to work only for the first instance it encounters.
It does not highlight any colours for the rest of the columns or rows.
Any reasons why it would do this ?
- Mark as New
- Bookmark
- Subscribe
- Mute
- Subscribe to RSS Feed
- Permalink
- Report Inappropriate Content
Instead of using the name of the expression, try using the expression itself.