Unlock a world of possibilities! Login now and discover the exclusive benefits awaiting you.
- Qlik Community
- :
- All Forums
- :
- QlikView
- :
- Week aggregation
- Subscribe to RSS Feed
- Mark Topic as New
- Mark Topic as Read
- Float this Topic for Current User
- Bookmark
- Subscribe
- Mute
- Printer Friendly Page
- Mark as New
- Bookmark
- Subscribe
- Mute
- Subscribe to RSS Feed
- Permalink
- Report Inappropriate Content
Week aggregation
Hey Guys,
i have an additional problem:
I want to aggregate the data per day to data per week at the user surface, NOT in the Script.
For example:
Initiatl Situation:
raw data imported via sql-script:
01.01. 10
02.01 20
03.01 30
04.01 45
05.01 45
06.01. 50
07.01. 60
...
(e.g. 01.01. = Monday, 01.01. - 07.01. -> Week 1)
Favored Solution:
Output in a table-box:
CW 01 260
...
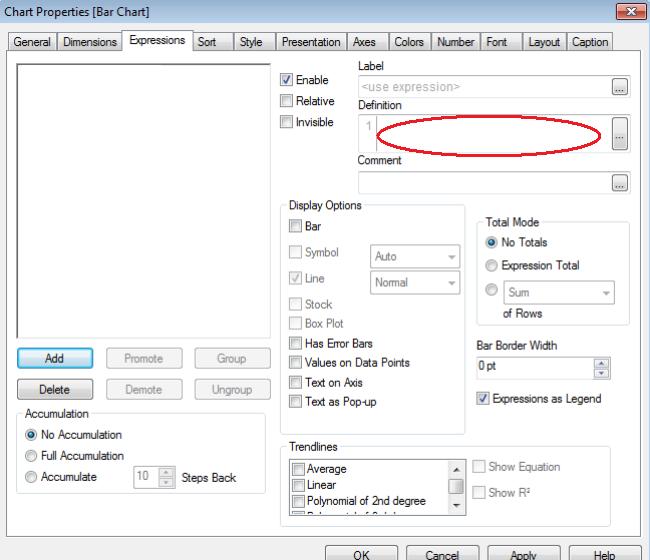
Is there a possibility to solve this problem in the chart properties via a definition?
Someone who has an idea?
Many thanks in advance!
- Mark as New
- Bookmark
- Subscribe
- Mute
- Subscribe to RSS Feed
- Permalink
- Report Inappropriate Content
Hi,
Only one change you need to do inscript, i.e Create a new field week from the date you have.
This will give you the week number for the given date.
You can create a new field as shown below.
Load
Date,
week(Date) as Week,
.......
From xyz.
Now you can use this week field in your chart to aggrigate the values.
Create a chart with dimension as Week and expression as Sum(Values).
Hope this helps.
Regards,
Kaushik Solanki
- Mark as New
- Bookmark
- Subscribe
- Mute
- Subscribe to RSS Feed
- Permalink
- Report Inappropriate Content
Or, if you don't have access to the script, you can use calcualted dimension (not chart expression), defined like this:
=week(Date)
Expression will be the same sum(Values)