Unlock a world of possibilities! Login now and discover the exclusive benefits awaiting you.
- Qlik Community
- :
- All Forums
- :
- QlikView App Dev
- :
- Weekly data for max dates
- Subscribe to RSS Feed
- Mark Topic as New
- Mark Topic as Read
- Float this Topic for Current User
- Bookmark
- Subscribe
- Mute
- Printer Friendly Page
- Mark as New
- Bookmark
- Subscribe
- Mute
- Subscribe to RSS Feed
- Permalink
- Report Inappropriate Content
Weekly data for max dates
Hi guyz,
I have data with
| Date | Type | Balance |
|---|---|---|
| 1/9/2016 | A | 100 |
| 2/9/2016 | A | 42 |
| 5/9/2016 | A | 21 |
| 6/9/2016 | A | 213 |
| 9/9/2016 | A | 324 |
| 10/9/2016 | A | 4323 |
| 11/9/2016 | B | 213 |
| 7/9/2016 | A | 3423 |
| 8/9/2016 | A | 324 |
| 12/9/2016 | A | 65 |
| 13/9/2016 | A | 4544 |
| 16/9/2016 | A | 343 |
| 16/9/2016 | B | 23421 |
| 16/9/2016 | A | 341 |
| 16/9/2016 | A | 3543 |
I need Weekly bar chart. Every Friday balance amount in the account.
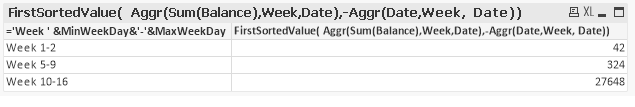
need bar chart with Week 1-2 -> 42
Week 5-9 -> 324
Week 12-16 -> 6568
in bar chart together
Accepted Solutions
- Mark as New
- Bookmark
- Subscribe
- Mute
- Subscribe to RSS Feed
- Permalink
- Report Inappropriate Content
Try like:
Table:
LOAD Date,
Week(Weekstart(Date,0,-2)) as Week,
WeekDay(Date) as WeekDay,
Day(Date) as Day,
Type,
Balance
FROM
[https://community.qlik.com/thread/234094]
(html, codepage is 1252, embedded labels, table is @1) where Len(Trim(Date))>0;
Join
Load
Week,
Max(Day) as MaxWeekDay,
Min(Day) as MinWeekDay
Resident Temp Group By Week;
- Mark as New
- Bookmark
- Subscribe
- Mute
- Subscribe to RSS Feed
- Permalink
- Report Inappropriate Content
How is Week 12-16 -> 6568 coming?
- Mark as New
- Bookmark
- Subscribe
- Mute
- Subscribe to RSS Feed
- Permalink
- Report Inappropriate Content
Try like:
Table:
LOAD Date,
Week(Weekstart(Date,0,-2)) as Week,
WeekDay(Date) as WeekDay,
Day(Date) as Day,
Type,
Balance
FROM
[https://community.qlik.com/thread/234094]
(html, codepage is 1252, embedded labels, table is @1) where Len(Trim(Date))>0;
Join
Load
Week,
Max(Day) as MaxWeekDay,
Min(Day) as MinWeekDay
Resident Temp Group By Week;
- Mark as New
- Bookmark
- Subscribe
- Mute
- Subscribe to RSS Feed
- Permalink
- Report Inappropriate Content
sorry my mistake...its sum of all balance