Unlock a world of possibilities! Login now and discover the exclusive benefits awaiting you.
- Qlik Community
- :
- All Forums
- :
- QlikView App Dev
- :
- What is the best way to developed attached operati...
- Subscribe to RSS Feed
- Mark Topic as New
- Mark Topic as Read
- Float this Topic for Current User
- Bookmark
- Subscribe
- Mute
- Printer Friendly Page
- Mark as New
- Bookmark
- Subscribe
- Mute
- Subscribe to RSS Feed
- Permalink
- Report Inappropriate Content
What is the best way to developed attached operating performance report?
Hi everyone,
Please help me to give an idea how I can develop this report.Here the problem I am facing in the middle of month I have to show month percentage.
My data format is like that
Transaction table ->
Particular Year Month Amount
Net Sales - 2012 - 7 - 500
Net Sales - 2012 - 8 - 1500
Net Sales - 2012 - 9 - 2500
Net Sales - 2011 - 7 - 2500
Net Sales - 2011 - 8 - 3500
Net Sales - 2011 - 9 - 4500
Budget Table - >
Particular Year Month Amount
Net Sales - 2012 - 7 - 2500
Net Sales - 2012 - 8 - 1500
Net Sales - 2012 - 9 - 500
Net Sales - 2011 - 7 - 500
Net Sales - 2011 - 8 - 500
Net Sales - 2011 - 9 - 500
Advance thanks to seeing it.
Thanks
Saif
Accepted Solutions
- Mark as New
- Bookmark
- Subscribe
- Mute
- Subscribe to RSS Feed
- Permalink
- Report Inappropriate Content
Hi.
Keeping your data model as is, in addition to month dimension in chart you can try to create a synthetic dimension =ValueList('Last Year 11-12', 'Budget 12-13', 'Actual 12-13')
Then you're able to create two expressions. One to show absolutes and one for percent:
=pick(match(ValueList('Last Year 11-12', 'Budget 12-13', 'Actual 12-13'), 'Last Year 11-12', 'Budget 12-13', 'Actual 12-13'), [expression for Last Year 11-12 value], [expression for Budget 12-13], [expression for Actual 12-13])
=pick(match(ValueList('Last Year 11-12', 'Budget 12-13', 'Actual 12-13'), 'Last Year 11-12', 'Budget 12-13', 'Actual 12-13'), null(), 1, [expression for % Actual 12-13/Budget 12-13])
- Mark as New
- Bookmark
- Subscribe
- Mute
- Subscribe to RSS Feed
- Permalink
- Report Inappropriate Content
Hi,
Thanks for answering.Actually it is easy for me to show Actual(this year) and last year(year-1) and budget(this year) value just based on selection.and if in expressions I have three calculation for Actual,Last year and budget.In dimension I will have Particular ,Year and month.If I pivot Month then it is fine to show top of the list but in between month I need percentage calculation.
Appreciate if you have a sample with few inline data.
Thanks
saif
- Mark as New
- Bookmark
- Subscribe
- Mute
- Subscribe to RSS Feed
- Permalink
- Report Inappropriate Content
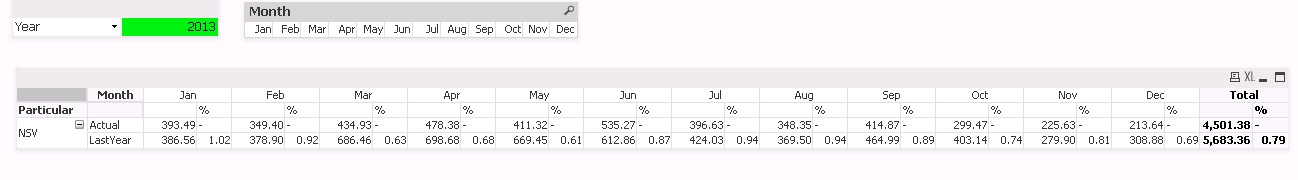
Hi,
I think I am close to complete as per your direction.If you see XL file there is another column at the end "Achievement over last year(%)" based on total value.Do you have any solution about this.
Thanks
saif
- Mark as New
- Bookmark
- Subscribe
- Mute
- Subscribe to RSS Feed
- Permalink
- Report Inappropriate Content
Hi.
The easiest way is to create an additional chart for that totals.
If the user is not supposed to scroll it - fine, if not - he'll see the last year results regardless of the scroll position - seems fine.
The only drawback is that the export to excel will be a little bit tricky (macro).