Unlock a world of possibilities! Login now and discover the exclusive benefits awaiting you.
- Qlik Community
- :
- All Forums
- :
- QlikView App Dev
- :
- Why Box Plot is not enabled?
- Subscribe to RSS Feed
- Mark Topic as New
- Mark Topic as Read
- Float this Topic for Current User
- Bookmark
- Subscribe
- Mute
- Printer Friendly Page
- Mark as New
- Bookmark
- Subscribe
- Mute
- Subscribe to RSS Feed
- Permalink
- Report Inappropriate Content
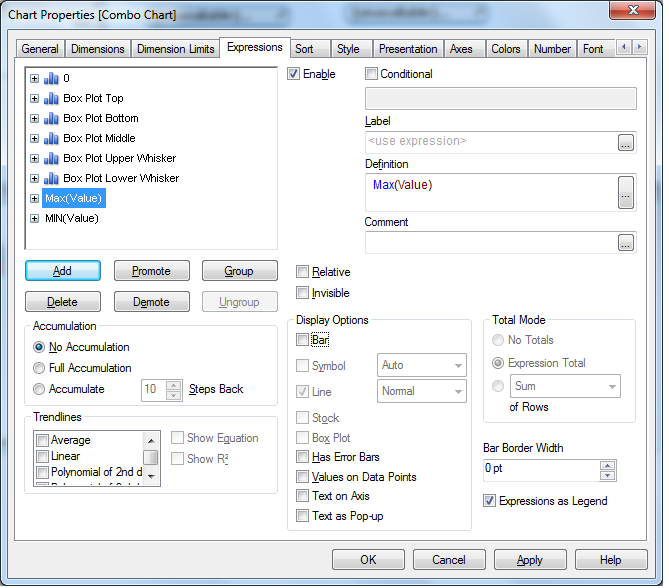
Why Box Plot is not enabled?
Why Box Plot is not enabled?
Navigation: Chart > Combo Chart >Expressions> Display options.
Thanks in advance.
- Tags:
- new_to_qlikview
Accepted Solutions
- Mark as New
- Bookmark
- Subscribe
- Mute
- Subscribe to RSS Feed
- Permalink
- Report Inappropriate Content
- Go to the Tools menu and choose “Box Plot Wizard”.
- On the “Step 1 - Define data” page, you choose your dimension. In my example, this was Machine, but it could be Supplier or Batch or something similar.
- Use the same dimension once more in the “Aggregator” control.
- Use the average of your measurement in the “Expression” control – Avg(Measurement).
- Click “Next”.
- On the “Step 2 - Presentation” page, you should choose “Median mode”.
- Check “Include Whiskers” and “Use Outliers”.
- Click “Finish”.
See more details here : http://community.qlik.com/blogs/qlikviewdesignblog/2014/08/18/recipe-for-a-box-plot
- Mark as New
- Bookmark
- Subscribe
- Mute
- Subscribe to RSS Feed
- Permalink
- Report Inappropriate Content
Hi
just un check the Bar or Line and then
boxplot will be enabled
- Mark as New
- Bookmark
- Subscribe
- Mute
- Subscribe to RSS Feed
- Permalink
- Report Inappropriate Content
I tried but still the same.
- Mark as New
- Bookmark
- Subscribe
- Mute
- Subscribe to RSS Feed
- Permalink
- Report Inappropriate Content
For max and min values
select symbol to display ,these two are set for Ranges, in between these two only your box plot will show
if you are not able to get it , please post your sample .qvw
- Mark as New
- Bookmark
- Subscribe
- Mute
- Subscribe to RSS Feed
- Permalink
- Report Inappropriate Content
- Go to the Tools menu and choose “Box Plot Wizard”.
- On the “Step 1 - Define data” page, you choose your dimension. In my example, this was Machine, but it could be Supplier or Batch or something similar.
- Use the same dimension once more in the “Aggregator” control.
- Use the average of your measurement in the “Expression” control – Avg(Measurement).
- Click “Next”.
- On the “Step 2 - Presentation” page, you should choose “Median mode”.
- Check “Include Whiskers” and “Use Outliers”.
- Click “Finish”.
See more details here : http://community.qlik.com/blogs/qlikviewdesignblog/2014/08/18/recipe-for-a-box-plot
- Mark as New
- Bookmark
- Subscribe
- Mute
- Subscribe to RSS Feed
- Permalink
- Report Inappropriate Content
Hey,
Attach Sample
Regards,
Chinna
- Mark as New
- Bookmark
- Subscribe
- Mute
- Subscribe to RSS Feed
- Permalink
- Report Inappropriate Content
Thank you Sasikanth.
How to insert a file? I know for image.
Sorry for silly doubt 
- Mark as New
- Bookmark
- Subscribe
- Mute
- Subscribe to RSS Feed
- Permalink
- Report Inappropriate Content
Thank you Sasikanth,Chinna and tresesco.