Unlock a world of possibilities! Login now and discover the exclusive benefits awaiting you.
- Qlik Community
- :
- All Forums
- :
- QlikView App Dev
- :
- Write Expression to include a sum of multiple "Gro...
- Subscribe to RSS Feed
- Mark Topic as New
- Mark Topic as Read
- Float this Topic for Current User
- Bookmark
- Subscribe
- Mute
- Printer Friendly Page
- Mark as New
- Bookmark
- Subscribe
- Mute
- Subscribe to RSS Feed
- Permalink
- Report Inappropriate Content
Write Expression to include a sum of multiple "Groups" AND one of those Groups as two fields in a chart
I am struggling to write the expression needed to output two types of data into a single chart. I would like to have two bars in a chart: 1) Bar 1 would be the sum of 5 different groups, and 2) Bar 2 would be one of those 5 groups.
Of what you see below, I'd like to have one bar be the sum of all of the [QP.SourceGroup] types in my current expression, and the other bar be the [QP.SourceGroup]='Warranty' seperate from the sum bar.
PLEASE HELP 
- Mark as New
- Bookmark
- Subscribe
- Mute
- Subscribe to RSS Feed
- Permalink
- Report Inappropriate Content
Try creating a bar chart with no dimesions and 2 expressions.
One would be using sum({< [QP.SourceGroup]={'Warranty'}>} Value)
other could be sum({< [QP.SourceGroup]=>} Value)
- Mark as New
- Bookmark
- Subscribe
- Mute
- Subscribe to RSS Feed
- Permalink
- Report Inappropriate Content
All blurry images shown below are attached for clearer review.
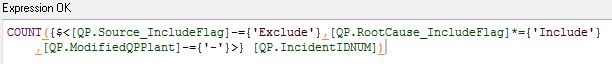
Well, I'm afraid it's more complicated than that. You see, my data source is a similar to access and has fields, such as Raised Date, Source Type (was it Warranty or Non-Warranty), Incident Number, and Root Cause. There are rules to be considered; here is an example of the current Expression that is working in conjunction with two dimensions:
The dimensions I'm using are: 1) DateGroup (from a table), and 2) a Calculated Dimension to include the specific "SourceGroups" I want to see in my bar chart. See below:
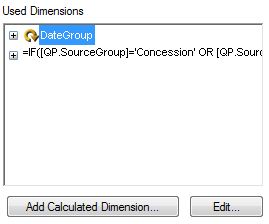
The calculated dimension is:

The Chart Output is: *Dummy data used for this example
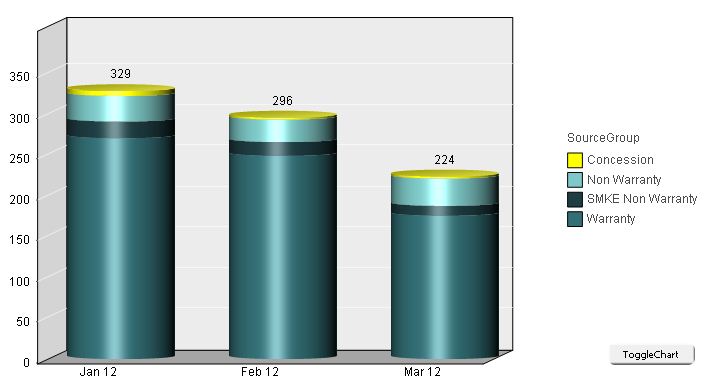
Ultimately, what I'm looking for is a one column as a sum of all SourceGroups together (not stacked or broken apart) and a second column with only Warranty.
Does this help at all?