Unlock a world of possibilities! Login now and discover the exclusive benefits awaiting you.
- Qlik Community
- :
- All Forums
- :
- QlikView App Dev
- :
- Y axis alignment
- Subscribe to RSS Feed
- Mark Topic as New
- Mark Topic as Read
- Float this Topic for Current User
- Bookmark
- Subscribe
- Mute
- Printer Friendly Page
- Mark as New
- Bookmark
- Subscribe
- Mute
- Subscribe to RSS Feed
- Permalink
- Report Inappropriate Content
Y axis alignment
Hi,
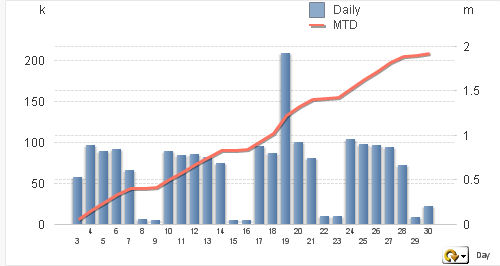
Does anyone know how to allign the left and right y - values so that when a grid is displayed the horizontal lines for each are in the same place.
From the below I would like the 50 (on the left) to align to the 0.5 (on the right) etc...
Regards
Jay
- Mark as New
- Bookmark
- Subscribe
- Mute
- Subscribe to RSS Feed
- Permalink
- Report Inappropriate Content
Did you try to assign static Min/Max/Step? (Chart Properties > Axes tab)
Regards,
Florian
- Mark as New
- Bookmark
- Subscribe
- Mute
- Subscribe to RSS Feed
- Permalink
- Report Inappropriate Content
Thanks Florian, I did try that however my min/max/step had to be dynamic. I was writing a response to your post and got thinking of this and came up with a solution using the min/max/step as you suggested however using an expression to calculate the values.
One of the issues was that the figures for the expression in the image I posted can change and therefore the min/max values change and the number of steps would change. Another problem I had was that I had other expressions in the same chart that where hidden with a conditional show and the min/max values for these where also completely different.
Thanks for your response anyhow as it made me think a bit more about what I was doing.
Jay