Unlock a world of possibilities! Login now and discover the exclusive benefits awaiting you.
- Qlik Community
- :
- All Forums
- :
- QlikView App Dev
- :
- YTD calculation reset at a New Year
- Subscribe to RSS Feed
- Mark Topic as New
- Mark Topic as Read
- Float this Topic for Current User
- Bookmark
- Subscribe
- Mute
- Printer Friendly Page
- Mark as New
- Bookmark
- Subscribe
- Mute
- Subscribe to RSS Feed
- Permalink
- Report Inappropriate Content
YTD calculation reset at a New Year
Hello All,
The requirement is to do a YTD count of tickets for a duration of 12 months. The duration extends from Jun'16 to Jun'17. The x-axis has months and the y-axis has the count of tickets. The tricky part is, the tickets should be counted and accumulated and at the start of a new year(Jan 2017), the count should be reset to 0 and the accumulation process repeated.
Any suggestions on how to implement this requirement?
- « Previous Replies
-
- 1
- 2
- Next Replies »
- Mark as New
- Bookmark
- Subscribe
- Mute
- Subscribe to RSS Feed
- Permalink
- Report Inappropriate Content
Hi Sunny,
Please find sample attached
- Mark as New
- Bookmark
- Subscribe
- Mute
- Subscribe to RSS Feed
- Permalink
- Report Inappropriate Content
For sample test purposes have changed the field names
- Mark as New
- Bookmark
- Subscribe
- Mute
- Subscribe to RSS Feed
- Permalink
- Report Inappropriate Content
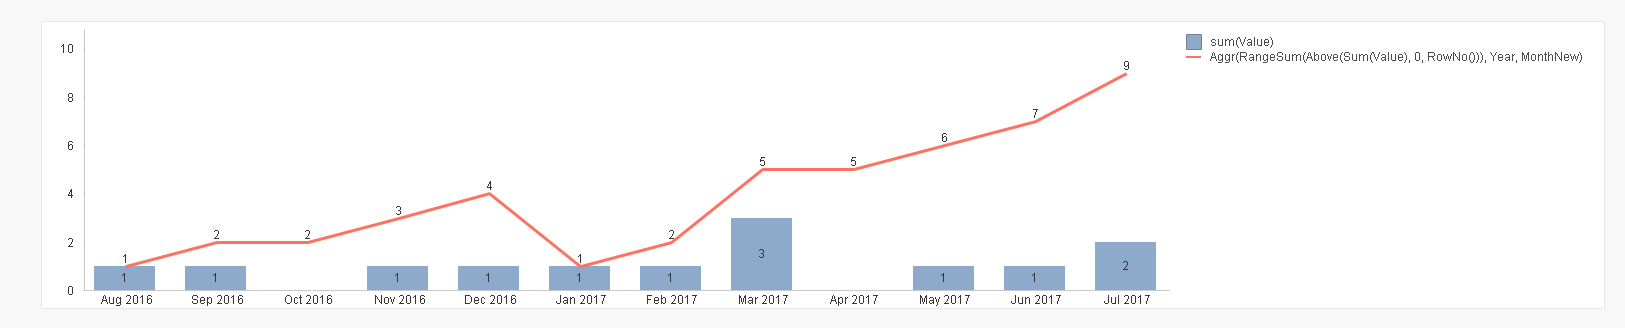
Script
Table:
LOAD Date#(Month, 'MMM YYYY') as Month,
Value;
LOAD * Inline
[Month, Value
Jul 2016,0
Aug 2016,1
Sep 2016,1
Oct 2016,0
Nov 2016,1
Dec 2016,1
Jan 2017,1
Feb 2017,1
Mar 2017,3
Apr 2017,0
May 2017,1
Jun 2017,1
Jul 2017,2
];
FinalTable:
LOAD *,
Month as MonthNew,
Year(Month) as Year
Resident Table
Order By Month;
DROP Table Table;
Expression
Aggr(RangeSum(Above(Sum(Value), 0, RowNo())), Year, MonthNew)
- Mark as New
- Bookmark
- Subscribe
- Mute
- Subscribe to RSS Feed
- Permalink
- Report Inappropriate Content
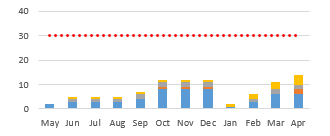
Thank you for the quick reply. Also, if I have to do the same thing to obtain the YTD for bar chart, how do I go about it?
It should look somewhat like this :
- Mark as New
- Bookmark
- Subscribe
- Mute
- Subscribe to RSS Feed
- Permalink
- Report Inappropriate Content
Not sure I understand, but may be like attached
- « Previous Replies
-
- 1
- 2
- Next Replies »