Unlock a world of possibilities! Login now and discover the exclusive benefits awaiting you.
- Qlik Community
- :
- All Forums
- :
- QlikView App Dev
- :
- aggregation on group level ????????
- Subscribe to RSS Feed
- Mark Topic as New
- Mark Topic as Read
- Float this Topic for Current User
- Bookmark
- Subscribe
- Mute
- Printer Friendly Page
- Mark as New
- Bookmark
- Subscribe
- Mute
- Subscribe to RSS Feed
- Permalink
- Report Inappropriate Content
aggregation on group level ????????
HI All,
| COMP | rating | NAME |
| A | 1 | subbu |
| A | 1 | MANI |
| A | 2 | NANI |
| A | 2 | BUJJI |
| A | 2 | CIHNNU |
| B | 1 | ANJEE |
| B | 2 | MANI |
| B | 3 | NANI |
| B | 4 | BUJJI |
| B | 5 | CIHNNU |
when we calculate average for COMP--A, Avg was 1.6,now i want to display the people count how many are above average and how many are below average.
if we round 1.6 to 2,then it should show count below avg as 2(subbu and mani)
Thanks,
Anjee
Accepted Solutions
- Mark as New
- Bookmark
- Subscribe
- Mute
- Subscribe to RSS Feed
- Permalink
- Report Inappropriate Content
- Mark as New
- Bookmark
- Subscribe
- Mute
- Subscribe to RSS Feed
- Permalink
- Report Inappropriate Content
Here it is an example
- Mark as New
- Bookmark
- Subscribe
- Mute
- Subscribe to RSS Feed
- Permalink
- Report Inappropriate Content
HI,
Thanks for ur quick response.
I need the representation in barchart like how many people are above avg and how many are below avg.
Can you please suggest .
Thanks,
Anjee
- Mark as New
- Bookmark
- Subscribe
- Mute
- Subscribe to RSS Feed
- Permalink
- Report Inappropriate Content
Like This?
- Mark as New
- Bookmark
- Subscribe
- Mute
- Subscribe to RSS Feed
- Permalink
- Report Inappropriate Content
Like This?
UPDATED FILE..
- Mark as New
- Bookmark
- Subscribe
- Mute
- Subscribe to RSS Feed
- Permalink
- Report Inappropriate Content
HI ,
almost same as that only .
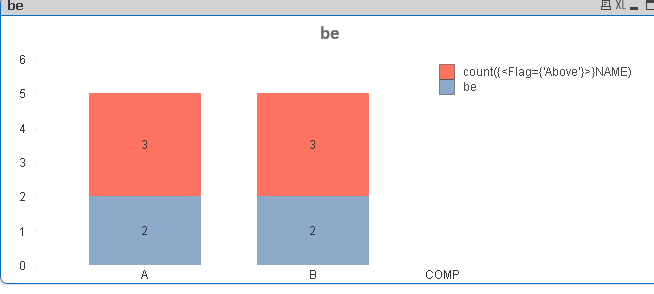
now i tried developing the count based on expression
=count({<Flag={'Above'}>}NAME).
I am getting the count.
earlier i tried this expression .
for BELOW expression :count({<rating={"<$(=ceil((avg(rating))))"}>}distinct name)
For ABOVE expression
dimension as comp
count({<rating={">=$(=ceil(avg(rating)))"}>}distinct name)
but i didnt got any result.
Is there any way of writing directly in the chart itself.
Can you please suggest me where i am getting wrong.
Thanks,
Anjee
- Mark as New
- Bookmark
- Subscribe
- Mute
- Subscribe to RSS Feed
- Permalink
- Report Inappropriate Content
Check my another reply...
- Mark as New
- Bookmark
- Subscribe
- Mute
- Subscribe to RSS Feed
- Permalink
- Report Inappropriate Content
HI,
Here there will be only one dimension that is COMP.
based on that dimension ,we have to show the expressions like how many are below average and how many are above average .
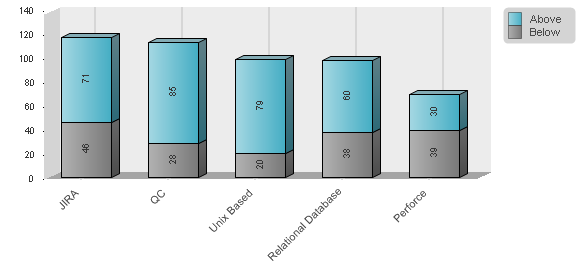
like i have showed you in the above attached image that blue shows "what is the count of people who are above avg and grey shows " what is the count of people below avg".
count({<rating={">=$(=ceil(aggr(avg(rating)),comp)"}>}distinct name)
Can you please suggest me whats wrong in the above expression.
Can we write in this way.
The solution you have provided is correct and it is working.
Thanks,
Anjee