Unlock a world of possibilities! Login now and discover the exclusive benefits awaiting you.
- Qlik Community
- :
- All Forums
- :
- QlikView App Dev
- :
- calculation within a chart question
- Subscribe to RSS Feed
- Mark Topic as New
- Mark Topic as Read
- Float this Topic for Current User
- Bookmark
- Subscribe
- Mute
- Printer Friendly Page
- Mark as New
- Bookmark
- Subscribe
- Mute
- Subscribe to RSS Feed
- Permalink
- Report Inappropriate Content
calculation within a chart question
hi all,
I have the following table
Store year Projected Amount
1 2015 1000
2 2016 1500
3 2017 800
4 2017 1200
5 2018 900
I need to build a bar chart of sum of future projected amount by year.. so 2015 will show everything in all years. 2016 will show the sum of 2016 and 2017 and 2017 will show only its value..doable?
Best,
Alec
- « Previous Replies
- Next Replies »
Accepted Solutions
- Mark as New
- Bookmark
- Subscribe
- Mute
- Subscribe to RSS Feed
- Permalink
- Report Inappropriate Content
Hi,
another solution could be a calculated dimension using the valueloop() function to create the year and an expression like
Sum( If(year>=valueloop(min(year),max(year)),[projected amount]))
Hope this helps
Regards
Marco
- Mark as New
- Bookmark
- Subscribe
- Mute
- Subscribe to RSS Feed
- Permalink
- Report Inappropriate Content
May be like this:
If(Year = 2015, Sum(Total [Projected Amount]),
If(Year = 2016, Sum(Total {<Year = {'2016', '2017'}>} [Projected Amount]),
If(Year = 2017, Sum(Total {<Year = {'2017'}>} [Projected Amount]))))
- Mark as New
- Bookmark
- Subscribe
- Mute
- Subscribe to RSS Feed
- Permalink
- Report Inappropriate Content
thank you for your quirk reply... I am looking for more dynamic solution rather than hard code the years...
- Mark as New
- Bookmark
- Subscribe
- Mute
- Subscribe to RSS Feed
- Permalink
- Report Inappropriate Content
Can you replace the hard coded values with Min(Year) and Max(Year)?
So If(Year = Min(Year), Sum(Total [Projected Amount]),
If(Year = Max(Year), Sum(Total {<Year = {$(=Max(Year))}> [Projected Amount]}, and so on...
- Mark as New
- Bookmark
- Subscribe
- Mute
- Subscribe to RSS Feed
- Permalink
- Report Inappropriate Content
Hi Alec,
There is a number of ways to do it - some more scalable than others. The most scalable solution is to create a so called "As of Date" table and associate your "display" year with the "forecast" year. This way, 2015 can be associated with 2015, 2016, 2017 etc...
You can find a number of free sources describing how to create the "As of Date" table, including my blog:
QlikView Blog Q-Tip #4 How to Use "As of Date" table | Natural Synergies
It's also described in detail in my new book "QlikView Your Business".
cheers,
Oleg Troyansky
QlikView Your Business: An expert guide to Business Discovery with QlikView and Qlik Sense
- Mark as New
- Bookmark
- Subscribe
- Mute
- Subscribe to RSS Feed
- Permalink
- Report Inappropriate Content
Hi please find attached qvw , it may be helpful.
Thanks
Kiran Kumar
- Mark as New
- Bookmark
- Subscribe
- Mute
- Subscribe to RSS Feed
- Permalink
- Report Inappropriate Content
thank you all.. I need to stay away from hard coding the years.. the above sample is not the actual data and we dont know the actual years.
- Mark as New
- Bookmark
- Subscribe
- Mute
- Subscribe to RSS Feed
- Permalink
- Report Inappropriate Content
Not a great solution, but this can be optimized better:
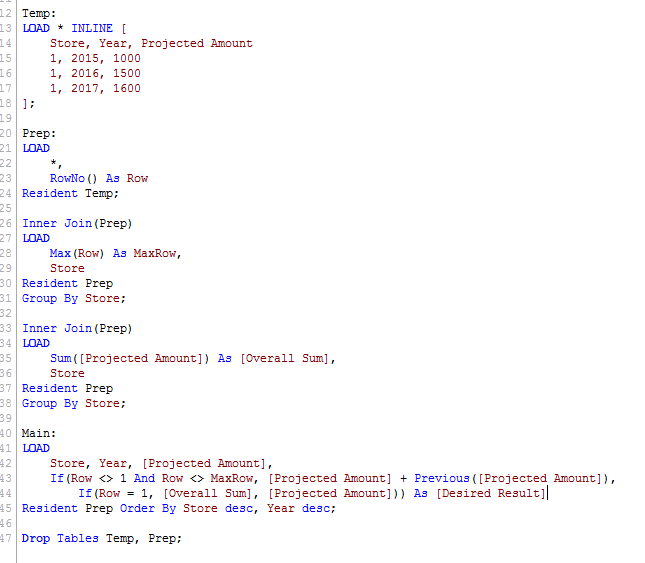
This gives you the below data model:

Thanks
- Mark as New
- Bookmark
- Subscribe
- Mute
- Subscribe to RSS Feed
- Permalink
- Report Inappropriate Content
thank you Sinan, Can you send me the qvw..
- Mark as New
- Bookmark
- Subscribe
- Mute
- Subscribe to RSS Feed
- Permalink
- Report Inappropriate Content
Sure. Please see the attached.
Hope it helps.
Thanks
- « Previous Replies
- Next Replies »