Unlock a world of possibilities! Login now and discover the exclusive benefits awaiting you.
- Qlik Community
- :
- All Forums
- :
- QlikView App Dev
- :
- can do a scatter chart by combine dots and a line ...
Options
- Subscribe to RSS Feed
- Mark Topic as New
- Mark Topic as Read
- Float this Topic for Current User
- Bookmark
- Subscribe
- Mute
- Printer Friendly Page
Turn on suggestions
Auto-suggest helps you quickly narrow down your search results by suggesting possible matches as you type.
Showing results for
Not applicable
2014-08-21
02:57 AM
- Mark as New
- Bookmark
- Subscribe
- Mute
- Subscribe to RSS Feed
- Permalink
- Report Inappropriate Content
can do a scatter chart by combine dots and a line in qlikview??
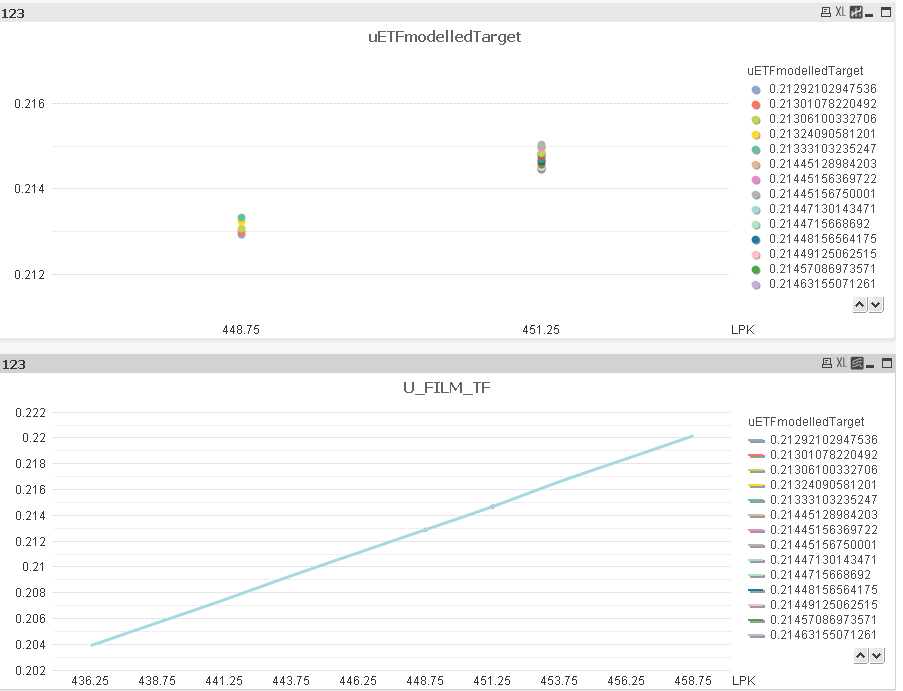
Is this possible to combine these 2 graph to become a scatter chart in QV???
- Tags:
- new_to_qlikview
429 Views
2 Replies
Not applicable
2014-08-21
03:36 AM
Author
- Mark as New
- Bookmark
- Subscribe
- Mute
- Subscribe to RSS Feed
- Permalink
- Report Inappropriate Content
Hi,
You could allways repeat the same expression two times, then choose one of those representations for each of them.
338 Views
Not applicable
2014-08-21
03:47 AM
Author
- Mark as New
- Bookmark
- Subscribe
- Mute
- Subscribe to RSS Feed
- Permalink
- Report Inappropriate Content
just add in on expression there only? dimension there no need add anything?
338 Views