Unlock a world of possibilities! Login now and discover the exclusive benefits awaiting you.
- Qlik Community
- :
- All Forums
- :
- QlikView App Dev
- :
- chart and expression help
- Subscribe to RSS Feed
- Mark Topic as New
- Mark Topic as Read
- Float this Topic for Current User
- Bookmark
- Subscribe
- Mute
- Printer Friendly Page
- Mark as New
- Bookmark
- Subscribe
- Mute
- Subscribe to RSS Feed
- Permalink
- Report Inappropriate Content
chart and expression help
Hi,
Want the following expression to work in a text box and a gauge chart (one of those where it fills up). The calculation is as follows:
Count([COR4. How satisfied or dissatisfied are you that your rent provides value for money?])/[Minimum req'd to meet STAR]
The expression above works fine in a pivot table chart but no other types or a text box.
*Had to convert from a live app so in chart says sum as opposed to count
It is just not working at all - appreciate any help.
Chris
- Tags:
- new_to_qlikview
Accepted Solutions
- Mark as New
- Bookmark
- Subscribe
- Mute
- Subscribe to RSS Feed
- Permalink
- Report Inappropriate Content
you can 'focus' the expression to calculate within the context of any filter you like using SET ANALYSIS.
The SET statement is as follows. '$' means have the expression follow the user's selection. <[Need Category]={'General Needs'}> means that no matter what the user selects, always ensure [Need Category] is only showing numbers for 'General Needs'. You can do this in any aggregation function
{$<[Need Category]={'General Needs'}>}
Here is a sample that will work in a text box in your app
=num(
count( {$<[Need Category]={'General Needs'}>} [COR4. How satisfied or dissatisfied are you that your rent provides value for money?])
/
sum( {$<[Need Category]={'General Needs'}>} [Minimum req'd to meet STAR])
,
'#,##0.00%')
- Mark as New
- Bookmark
- Subscribe
- Mute
- Subscribe to RSS Feed
- Permalink
- Report Inappropriate Content
Not sure what you're trying to do here. Based on your expression it looks like you're trying to count a division expression? Could you provide some clarity?
- Mark as New
- Bookmark
- Subscribe
- Mute
- Subscribe to RSS Feed
- Permalink
- Report Inappropriate Content
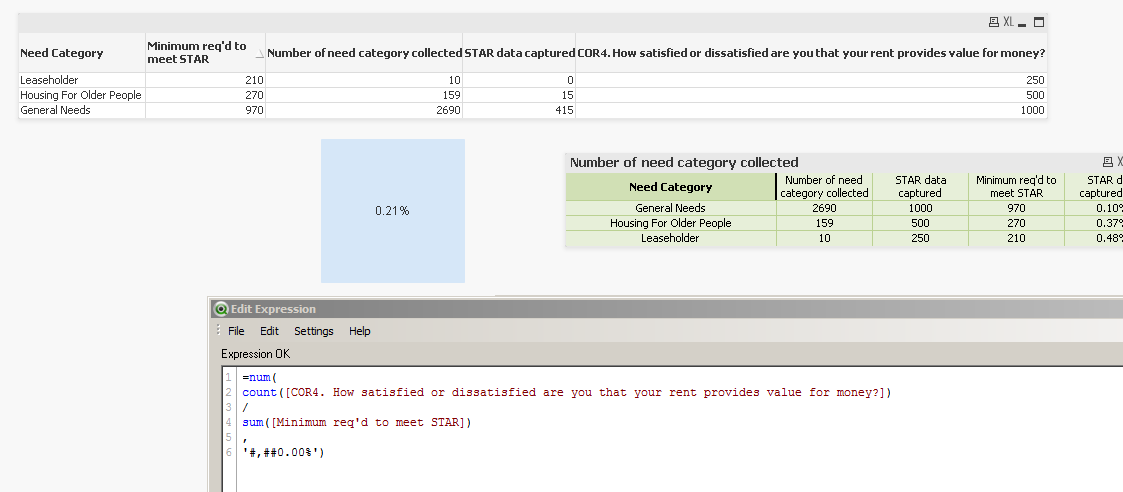
Your data model has 3 rows and 3 values for '[Minimum req'd to meet STAR]'
if you count up the [COR4. How satisfied or dissatisfied are you that your rent provides value for money?] field , it doesn't know which value to divide it by.
You need to aggregate the denomitor too.
Here is an example with sum().
I also wrapped the output in the num() function to format as a %
---------
=num(
count([COR4. How satisfied or dissatisfied are you that your rent provides value for money?])
/
sum([Minimum req'd to meet STAR])
,
'#,##0.00%')
- Mark as New
- Bookmark
- Subscribe
- Mute
- Subscribe to RSS Feed
- Permalink
- Report Inappropriate Content
Maybe something like =sum(aggr(sum([COR4. How satisfied or dissatisfied are you that your rent provides value for money?]), [Need Category])/aggr(sum([Minimum req'd to meet STAR]), [Need Category]))
- Mark as New
- Bookmark
- Subscribe
- Mute
- Subscribe to RSS Feed
- Permalink
- Report Inappropriate Content
Like This?
- Mark as New
- Bookmark
- Subscribe
- Mute
- Subscribe to RSS Feed
- Permalink
- Report Inappropriate Content
Hi Jonathon,
This provides a figure which is good. You will notice there is 3 needs category : general needs, leaseholder and housing for older people. Can you advise how to amend your expression so we could have 3 charts - each one just showing % for that need category...somwething along the lines if 'needs category = genral needs' I guess.
So essebtially on the app if I just selct 'geenral needs' your expressionprovies the above answer. Want the expression on the chart to do tis wihtout having to select each needs category.
Chris
- Mark as New
- Bookmark
- Subscribe
- Mute
- Subscribe to RSS Feed
- Permalink
- Report Inappropriate Content
you can 'focus' the expression to calculate within the context of any filter you like using SET ANALYSIS.
The SET statement is as follows. '$' means have the expression follow the user's selection. <[Need Category]={'General Needs'}> means that no matter what the user selects, always ensure [Need Category] is only showing numbers for 'General Needs'. You can do this in any aggregation function
{$<[Need Category]={'General Needs'}>}
Here is a sample that will work in a text box in your app
=num(
count( {$<[Need Category]={'General Needs'}>} [COR4. How satisfied or dissatisfied are you that your rent provides value for money?])
/
sum( {$<[Need Category]={'General Needs'}>} [Minimum req'd to meet STAR])
,
'#,##0.00%')