Unlock a world of possibilities! Login now and discover the exclusive benefits awaiting you.
- Qlik Community
- :
- All Forums
- :
- QlikView App Dev
- :
- chart formula
- Subscribe to RSS Feed
- Mark Topic as New
- Mark Topic as Read
- Float this Topic for Current User
- Bookmark
- Subscribe
- Mute
- Printer Friendly Page
- Mark as New
- Bookmark
- Subscribe
- Mute
- Subscribe to RSS Feed
- Permalink
- Report Inappropriate Content
chart formula
Hi QV community,
I have problems with a chartformula.
I have attached a qvw file with description of the problem.
every hint is appreciated!!!
thank you for helping 
- Mark as New
- Bookmark
- Subscribe
- Mute
- Subscribe to RSS Feed
- Permalink
- Report Inappropriate Content
Can you upload the file again because your file is reloaded when I open it.
- Mark as New
- Bookmark
- Subscribe
- Mute
- Subscribe to RSS Feed
- Permalink
- Report Inappropriate Content
when I open the uploaded qvw the field Daten_Recherchen is active!
- Mark as New
- Bookmark
- Subscribe
- Mute
- Subscribe to RSS Feed
- Permalink
- Report Inappropriate Content
here the file with qvd!
- Mark as New
- Bookmark
- Subscribe
- Mute
- Subscribe to RSS Feed
- Permalink
- Report Inappropriate Content
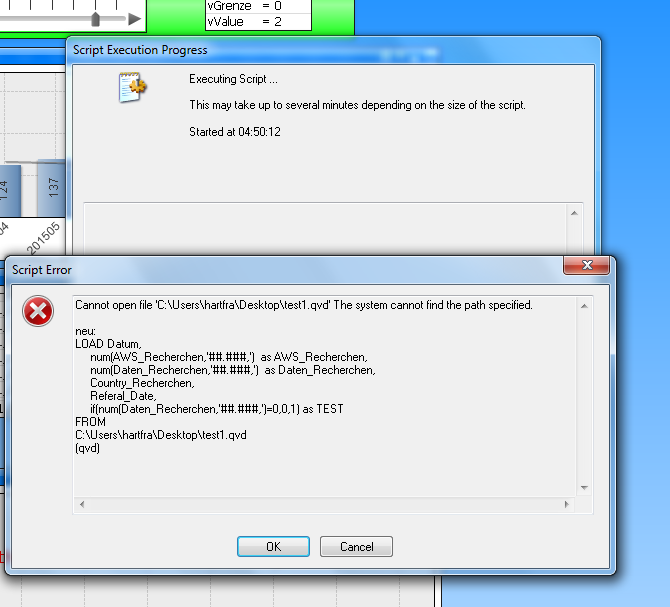
Agree with you but application is reloading when I open.
Please check the screen:
- Mark as New
- Bookmark
- Subscribe
- Mute
- Subscribe to RSS Feed
- Permalink
- Report Inappropriate Content
Can you please explain once.
Thanks
bunny.
- Mark as New
- Bookmark
- Subscribe
- Mute
- Subscribe to RSS Feed
- Permalink
- Report Inappropriate Content
on top off the dashboard there is slider. -1 = "last month", -2 = "month before last month" etc..
For "-1" I have 12 Outlets which are OK according to my metric. and there are 92 relevant Outlets.
For "-2" I had 15 Outlets which were OK and also 92 relevant outlets. now I want to show these ratios within a chart with "last 12 month" dimension!
- Mark as New
- Bookmark
- Subscribe
- Mute
- Subscribe to RSS Feed
- Permalink
- Report Inappropriate Content
any ideas?