Unlock a world of possibilities! Login now and discover the exclusive benefits awaiting you.
- Qlik Community
- :
- All Forums
- :
- QlikView App Dev
- :
- chart with time of timestamp
Options
- Subscribe to RSS Feed
- Mark Topic as New
- Mark Topic as Read
- Float this Topic for Current User
- Bookmark
- Subscribe
- Mute
- Printer Friendly Page
Turn on suggestions
Auto-suggest helps you quickly narrow down your search results by suggesting possible matches as you type.
Showing results for
Partner - Contributor III
2016-08-19
06:47 AM
- Mark as New
- Bookmark
- Subscribe
- Mute
- Subscribe to RSS Feed
- Permalink
- Report Inappropriate Content
chart with time of timestamp
Hello everyone,
i am trying to build a line chart timestamp vs value. The timestamp must be in format HH:MM and just 30 in 30 minutes.
I have this table:
| Timestamp(tstamp) | Value |
|---|---|
| 26-07-2016 17:00:10 | 25 |
| 26-07-2016 17:00:15 | 26 |
| 26-07-2016 17:30:00 | 25 |
| 26-07-2016 17:30:05 | 25 |
| 26-07-2016 17:42:00 | 25 |
| 26-07-2016 17:42:05 | 34 |
| 26-07-2016 17:43:10 | 25 |
| 26-07-2016 17:43:16 | 25,1 |
| 26-07-2016 18:00:10 | 27 |
| 26-07-2016 18:00:15 | 27 |
My line chart has as dimension the time from timestamp (HH:MM) (17:00, 17:30, 18:00, etc) and has as expression the value.
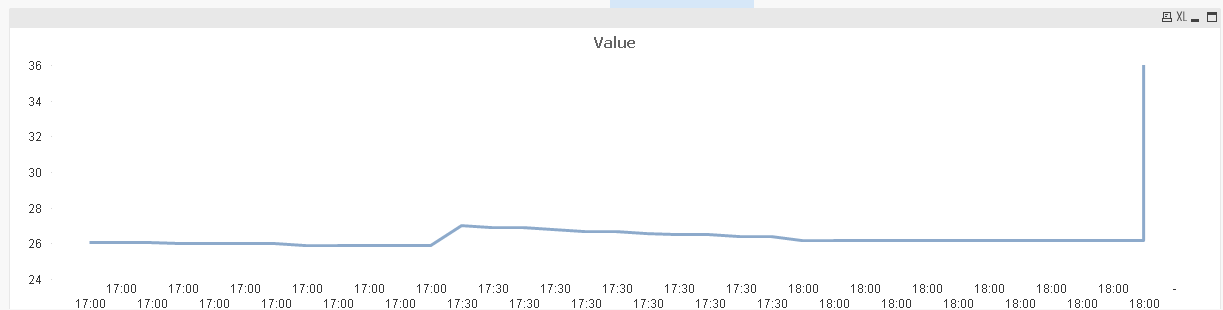
My current result is:
My dimension is:
=if(Minute(tstamp)=00 or Minute(tstamp)=30 ,timestamp(Timestamp(tstamp, 'YYYY-MM-DD HH:MM:SS'),'h:mm'))
My expression is the value.
Can someone help me with this problem?
Greetings
4,065 Views
- « Previous Replies
-
- 1
- 2
- Next Replies »
10 Replies
Partner - Contributor III
2016-08-22
04:08 AM
Author
- Mark as New
- Bookmark
- Subscribe
- Mute
- Subscribe to RSS Feed
- Permalink
- Report Inappropriate Content
It helps..thanks a lot 
Greetings
- « Previous Replies
-
- 1
- 2
- Next Replies »