Unlock a world of possibilities! Login now and discover the exclusive benefits awaiting you.
Announcements
FLASH SALE: Save $500! Use code FLASH2026 at checkout until Feb 14th at 11:59PM ET. Register Now!
- Qlik Community
- :
- All Forums
- :
- QlikView App Dev
- :
- chart y axis value
Options
- Subscribe to RSS Feed
- Mark Topic as New
- Mark Topic as Read
- Float this Topic for Current User
- Bookmark
- Subscribe
- Mute
- Printer Friendly Page
Turn on suggestions
Auto-suggest helps you quickly narrow down your search results by suggesting possible matches as you type.
Showing results for
Specialist
2016-08-03
09:52 AM
- Mark as New
- Bookmark
- Subscribe
- Mute
- Subscribe to RSS Feed
- Permalink
- Report Inappropriate Content
chart y axis value
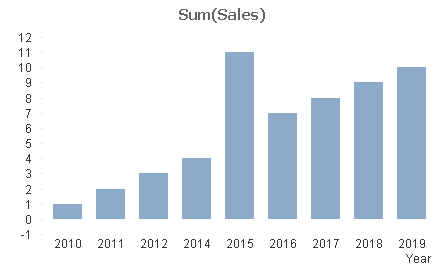
in my chart i want to start my y axis value from -1,
example the default vlaue of the y axis always start from 0 1 2 3 4 5 6
so i want to start it from -1
626 Views
6 Replies
2016-08-03
09:54 AM
- Mark as New
- Bookmark
- Subscribe
- Mute
- Subscribe to RSS Feed
- Permalink
- Report Inappropriate Content
How about Static Min is -1 and then Max whatever your want?
Best Anil, When applicable please mark the correct/appropriate replies as "solution" (you can mark up to 3 "solutions". Please LIKE threads if the provided solution is helpful
542 Views
Specialist
2016-08-03
10:02 AM
Author
- Mark as New
- Bookmark
- Subscribe
- Mute
- Subscribe to RSS Feed
- Permalink
- Report Inappropriate Content
even i applied statc -1 its not showing
542 Views
Not applicable
2016-08-03
10:12 AM
- Mark as New
- Bookmark
- Subscribe
- Mute
- Subscribe to RSS Feed
- Permalink
- Report Inappropriate Content
Please try this
Go to Presentation tab-->Unchek forced 0
under Expression scale set Min=-1,Max=10,Step =1
542 Views
2016-08-03
10:18 AM
- Mark as New
- Bookmark
- Subscribe
- Mute
- Subscribe to RSS Feed
- Permalink
- Report Inappropriate Content
Can you please send your Application for Sample
Update : PFA
Best Anil, When applicable please mark the correct/appropriate replies as "solution" (you can mark up to 3 "solutions". Please LIKE threads if the provided solution is helpful
542 Views
Not applicable
2016-08-03
10:21 AM
- Mark as New
- Bookmark
- Subscribe
- Mute
- Subscribe to RSS Feed
- Permalink
- Report Inappropriate Content
Please try this
Go to Presentation tab-->Unchek forced 0
under Expression scale set Min=-1,Max=10,Step =1
542 Views
Not applicable
2016-08-03
10:48 AM
- Mark as New
- Bookmark
- Subscribe
- Mute
- Subscribe to RSS Feed
- Permalink
- Report Inappropriate Content
sorry
Go to Axis tab-->
Unchek forced 0
under Expression scale set Min=-1,Max=10,Step =1
542 Views