Unlock a world of possibilities! Login now and discover the exclusive benefits awaiting you.
- Qlik Community
- :
- All Forums
- :
- QlikView App Dev
- :
- colour
- Subscribe to RSS Feed
- Mark Topic as New
- Mark Topic as Read
- Float this Topic for Current User
- Bookmark
- Subscribe
- Mute
- Printer Friendly Page
- Mark as New
- Bookmark
- Subscribe
- Mute
- Subscribe to RSS Feed
- Permalink
- Report Inappropriate Content
colour
Hi All,
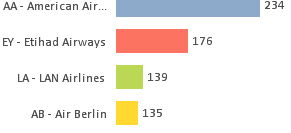
I wanted to know how can we change the colour of the fonts and values of the chart ....
if you look at the screenshot below the fonts and numbers are in black i wanted it to be in whte colour
Yhanks in advance
Accepted Solutions
- Mark as New
- Bookmark
- Subscribe
- Mute
- Subscribe to RSS Feed
- Permalink
- Report Inappropriate Content
- Mark as New
- Bookmark
- Subscribe
- Mute
- Subscribe to RSS Feed
- Permalink
- Report Inappropriate Content
- Mark as New
- Bookmark
- Subscribe
- Mute
- Subscribe to RSS Feed
- Permalink
- Report Inappropriate Content
Hi PM
thanks for the reply
I am able to change the expression colour fonts to white ,,,,Iam using drilldown as dimension for which iam not able to change the white fonts
can you please let me know how do we change the white text colour to a grouped dimension either drill down or cyclic ?
Thanks
- Mark as New
- Bookmark
- Subscribe
- Mute
- Subscribe to RSS Feed
- Permalink
- Report Inappropriate Content
Please share some sample app
- Mark as New
- Bookmark
- Subscribe
- Mute
- Subscribe to RSS Feed
- Permalink
- Report Inappropriate Content
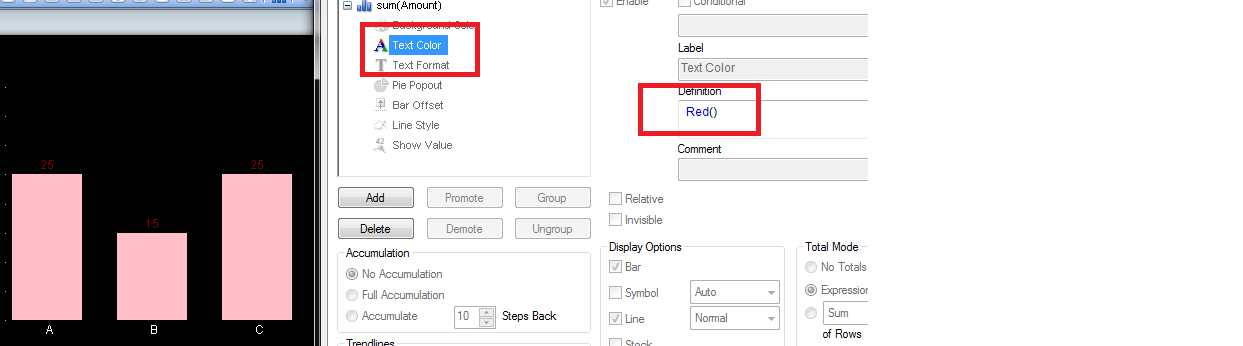
![2017-06-07 09_32_04-QlikView x64 Personal Edition - [C__Users_Michele.Denardi_Desktop_test.qvw_].png](/legacyfs/online/166034_2017-06-07 09_32_04-QlikView x64 Personal Edition - [C__Users_Michele.Denardi_Desktop_test.qvw_].png)
If a post helps to resolve your issue, please accept it as a Solution.
- Mark as New
- Bookmark
- Subscribe
- Mute
- Subscribe to RSS Feed
- Permalink
- Report Inappropriate Content
Hi Michele
It will change axis color also ....
- Mark as New
- Bookmark
- Subscribe
- Mute
- Subscribe to RSS Feed
- Permalink
- Report Inappropriate Content
PLease find the attachment of the two charts
i want the contents of legends also to be displayed in the white colour and alos the data values for pie chart.
Thakns
- Mark as New
- Bookmark
- Subscribe
- Mute
- Subscribe to RSS Feed
- Permalink
- Report Inappropriate Content
Hi
For this you need to change under Axes Tab. You can change both X- axis and Y-axis which ever color you want.
Hope it helps!!
- Mark as New
- Bookmark
- Subscribe
- Mute
- Subscribe to RSS Feed
- Permalink
- Report Inappropriate Content
For Pie Chart, You can change in under Presentation Tab>Legend Settings
- Mark as New
- Bookmark
- Subscribe
- Mute
- Subscribe to RSS Feed
- Permalink
- Report Inappropriate Content
PFA...