Unlock a world of possibilities! Login now and discover the exclusive benefits awaiting you.
- Qlik Community
- :
- All Forums
- :
- QlikView App Dev
- :
- count and stdev using aggr function
- Subscribe to RSS Feed
- Mark Topic as New
- Mark Topic as Read
- Float this Topic for Current User
- Bookmark
- Subscribe
- Mute
- Printer Friendly Page
- Mark as New
- Bookmark
- Subscribe
- Mute
- Subscribe to RSS Feed
- Permalink
- Report Inappropriate Content
count and stdev using aggr function
Hello! I hope your holidays have started well!
I have attached a document to this with a small portion of my data where I am trying to count the number of pieces of furniture sold, and then perform some statistical analysis on it (currently, find the standard deviation). The overall goal is to derive an understanding of which product is more successful and which items do not sell like the norm of the other tables.
Overall, I want to count the number of pieces sold, however, I do not load in an install count. What I have been doing so far is a count(1), simply counting the number of times that a type of instance occurs (ie, counting the number of times a piece is sold that is made of willow or oak). However, for more statistical analysis, I have started using the aggr function.
= sum(aggr(count(sale_value), _dimension_)))
However, in order to take the standard deviation to see if a certain combination, such as if a certain color of furniture that has a presence online and is bought by a return visitor, falls into normal purchasing behaviour for our customers, I would do
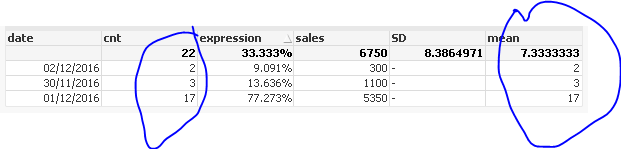
=stdev(aggr(count(sale_value), date)))
However, when I use this, it does not return values in the cells (only the actual standard deviation in the total line).
I would like to, in the end, also be able to see how far off the mean is/how far from normal purchasing behaviour certain instances are. So if furniture that are willow have an uncommonly low purchase value, I would like to know that. The formula I have been using is the following, but that doesn't work either  any help would be most appreciated!!
=if((count(sale_value)>(Stdev(aggr(count(sale_value), date)) + avg(aggr(count(sale_value), date)))), 'yes', ' no')
If you have any ideas on how I could make this work, I would greatly appreciate it!
Thanks so much!
- Mark as New
- Bookmark
- Subscribe
- Mute
- Subscribe to RSS Feed
- Permalink
- Report Inappropriate Content
STD is defined to a list with more than one value
=(aggr(count(sale_value), date))) would return only one value, that basically would return "0" as SD.
That´s because your totalization value has a defined value, because you have 3 distinct values
- Mark as New
- Bookmark
- Subscribe
- Mute
- Subscribe to RSS Feed
- Permalink
- Report Inappropriate Content
If you want the standard deviation from the sum values of each day please use
1) Create an ID for each dayxproduct combination
Load product, color, country, sale_value, date, delivered_to, return_customer, item_online,RowNo() as ID inline [
2) Use this:
=stdev(aggr(sum(sale_value), ID))
- Mark as New
- Bookmark
- Subscribe
- Mute
- Subscribe to RSS Feed
- Permalink
- Report Inappropriate Content
Thank you! I just edited my post as well to include a secondary part, being that I am trying to see if the instance's value is between one standard deviation and the mean (primarily interested in the upper value). Do you have any thoughts on this? Thank yoU!
- Mark as New
- Bookmark
- Subscribe
- Mute
- Subscribe to RSS Feed
- Permalink
- Report Inappropriate Content
Another thought
As you have "date" as dimension, Qlik will aggregate by date, you don´t need to specify this
=sum(aggr(count(sale_value), date))
becomes
count(sale_value)
And check "Sum of Rows" as Total Mode
- Mark as New
- Bookmark
- Subscribe
- Mute
- Subscribe to RSS Feed
- Permalink
- Report Inappropriate Content
You say "uncommonly low purchase value" but you are counting sale_value, wouldn´t you sum them?
What you mean by "instance's " ? It´s a date? It´s a Date x color x product combination?
- Mark as New
- Bookmark
- Subscribe
- Mute
- Subscribe to RSS Feed
- Permalink
- Report Inappropriate Content
Well by counting sale value, my purpose was simply to count the number of times there was a purchase. it could have counting the product itself. (basically, it is a work around for not including in the load script a line counting the number of purchases, such as '1' as purchase_count)
When I say instances, I mean that a combination of willow, nov 30th, chair is one instance while willow, dec 1st, and chair is another instance.
- Mark as New
- Bookmark
- Subscribe
- Mute
- Subscribe to RSS Feed
- Permalink
- Report Inappropriate Content
Almost getting what you need
In this case, mean an how many purchases are the same indicator?