Unlock a world of possibilities! Login now and discover the exclusive benefits awaiting you.
- Qlik Community
- :
- All Forums
- :
- QlikView App Dev
- :
- cummulative chart help.
Options
- Subscribe to RSS Feed
- Mark Topic as New
- Mark Topic as Read
- Float this Topic for Current User
- Bookmark
- Subscribe
- Mute
- Printer Friendly Page
Turn on suggestions
Auto-suggest helps you quickly narrow down your search results by suggesting possible matches as you type.
Showing results for
Contributor
2018-03-26
01:03 AM
- Mark as New
- Bookmark
- Subscribe
- Mute
- Subscribe to RSS Feed
- Permalink
- Report Inappropriate Content
cummulative chart help.
Hi,
Basically am new to qlik. it is simple but i am not able to find any solution. kindly help
i need to plot values like below :
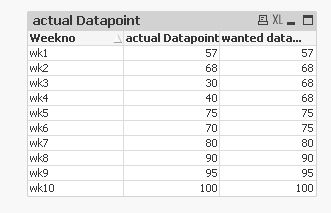
basically to plot values without dipping , if current value less than previous ploted value, need to plot the previous value
Help much appreciated. thanks in advance
633 Views
1 Solution
Accepted Solutions
MVP
2018-03-26
07:18 AM
- Mark as New
- Bookmark
- Subscribe
- Mute
- Subscribe to RSS Feed
- Permalink
- Report Inappropriate Content
569 Views
2 Replies
MVP
2018-03-26
07:18 AM
- Mark as New
- Bookmark
- Subscribe
- Mute
- Subscribe to RSS Feed
- Permalink
- Report Inappropriate Content
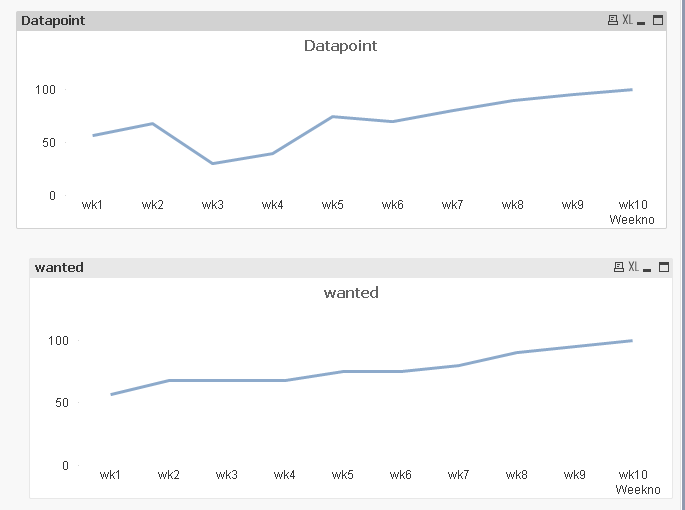
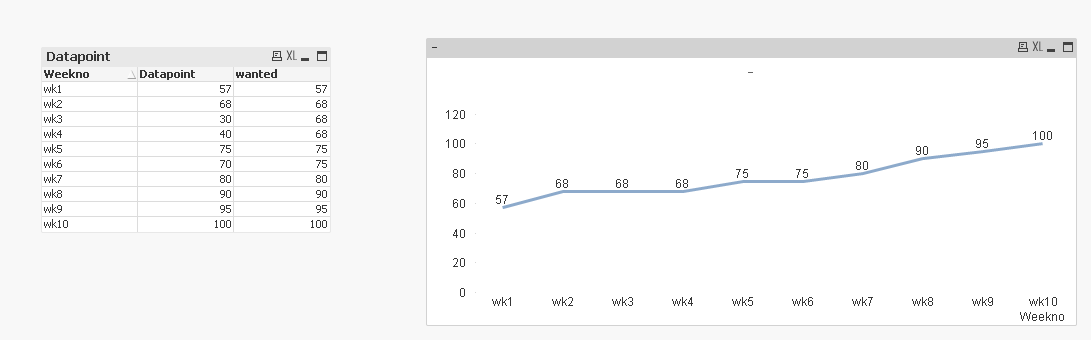
Try this
=RangeMax(Above(Column(1)), Datapoint)
570 Views
Contributor
2018-03-29
11:01 AM
Author
- Mark as New
- Bookmark
- Subscribe
- Mute
- Subscribe to RSS Feed
- Permalink
- Report Inappropriate Content
stalwar1 its working  Thanks a lot
569 Views