Unlock a world of possibilities! Login now and discover the exclusive benefits awaiting you.
- Qlik Community
- :
- All Forums
- :
- QlikView App Dev
- :
- different aggregation behaviour with missing value...
- Subscribe to RSS Feed
- Mark Topic as New
- Mark Topic as Read
- Float this Topic for Current User
- Bookmark
- Subscribe
- Mute
- Printer Friendly Page
- Mark as New
- Bookmark
- Subscribe
- Mute
- Subscribe to RSS Feed
- Permalink
- Report Inappropriate Content
different aggregation behaviour with missing values
Hi everybody. I have the following simple data model:
set NullInterpret ='';
tab:
LOAD * INLINE [
A, B
10, 20
];
tbc:
LOAD * INLINE [
B, C, E
20, 31, 50
];
tcd:
LOAD * INLINE [
C, D
31, 40
, 42
];
As you can see there is a missing value of C in the tcd table which is converted to null using NullInterpret .
The problem arises when I create the following charts:
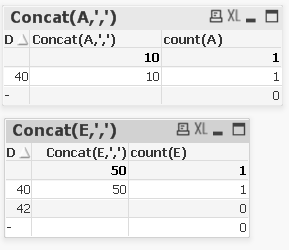
What I don't understand is why the aggregation on A does not display the 42 value of dimension D (which seems correct to me) while the aggregation on E displays it.
The only difference I see is that on A we have only 2 tables involved, while on E we have all the 3 tables involved.
Can someone explain me?
Thanks in advance,
Filippo