Unlock a world of possibilities! Login now and discover the exclusive benefits awaiting you.
- Qlik Community
- :
- All Forums
- :
- QlikView App Dev
- :
- display dates with no sales in the dimension
Options
- Subscribe to RSS Feed
- Mark Topic as New
- Mark Topic as Read
- Float this Topic for Current User
- Bookmark
- Subscribe
- Mute
- Printer Friendly Page
Turn on suggestions
Auto-suggest helps you quickly narrow down your search results by suggesting possible matches as you type.
Showing results for
Partner - Master II
2013-10-14
09:33 AM
- Mark as New
- Bookmark
- Subscribe
- Mute
- Subscribe to RSS Feed
- Permalink
- Report Inappropriate Content
display dates with no sales in the dimension
Hello
I got a pivot table
in the dimension I added Country, Brand, and Date
What I want to display is the following:
the user selects a year and a week of the year then I want to display all the days of the selected week and the one that has sales color the values in Greed and the days that don't have sales then color the background in red
Please advise
I can walk on water when it freezes
301 Views
2 Replies
Not applicable
2013-10-14
10:09 AM
- Mark as New
- Bookmark
- Subscribe
- Mute
- Subscribe to RSS Feed
- Permalink
- Report Inappropriate Content
Ali,
For your need, you have to make a calendar table to have all the day even if there are no sales on it.
Please find below a rapid example of what you can do.
Regards
Stephane
Master II
2013-10-14
04:37 PM
- Mark as New
- Bookmark
- Subscribe
- Mute
- Subscribe to RSS Feed
- Permalink
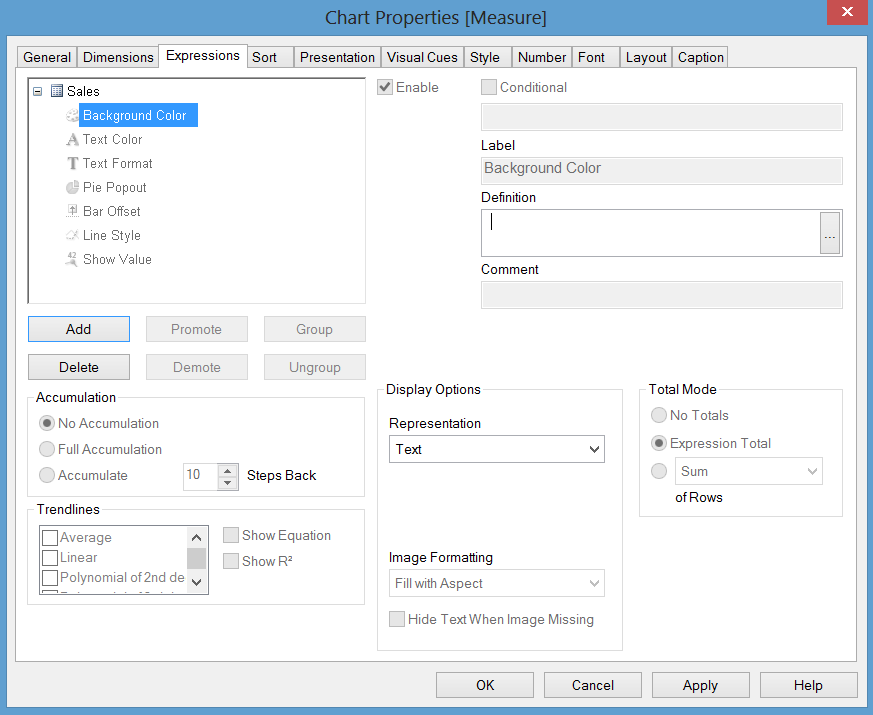
- Report Inappropriate Content
Add this expression to the Background color of the expression definition
IF(SUM(Sales) >=1, GREEN(), RGB(255,0,0))
254 Views