Unlock a world of possibilities! Login now and discover the exclusive benefits awaiting you.
- Qlik Community
- :
- All Forums
- :
- QlikView App Dev
- :
- display sum as data point above grouped bar chart
- Subscribe to RSS Feed
- Mark Topic as New
- Mark Topic as Read
- Float this Topic for Current User
- Bookmark
- Subscribe
- Mute
- Printer Friendly Page
- Mark as New
- Bookmark
- Subscribe
- Mute
- Subscribe to RSS Feed
- Permalink
- Report Inappropriate Content
display sum as data point above grouped bar chart
Hi, how do I sum up the 'inv turnover' (see in attached sample data) for each month and display it as a data point above the grouped bar chart like below? Each bar represents each site(see in attached sample data). Thanks.

- « Previous Replies
- Next Replies »
- Mark as New
- Bookmark
- Subscribe
- Mute
- Subscribe to RSS Feed
- Permalink
- Report Inappropriate Content
Hi, so sorry I can only open files I created myself as I'm using Personal Edition. Do you mind sending me screen shots instead? Thanks so much.
- Mark as New
- Bookmark
- Subscribe
- Mute
- Subscribe to RSS Feed
- Permalink
- Report Inappropriate Content
Hi,
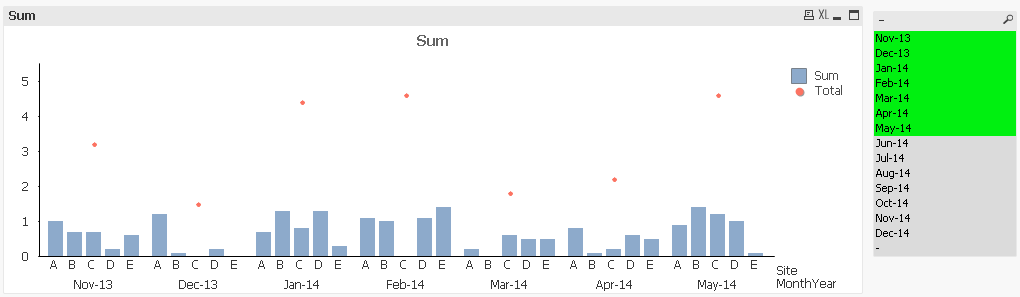
In this, I have taken 2 dimensions, firstly "Month(MonthYear)&'-'&Mid(Year(MonthYear),3,4)" i.e. MonthYear and then Site. Then I have taken 2 Expressions:
1st one: "Sum: sum([inv turnover])"
2nd one: "Total: =sum(TOTAL<MonthYear>[inv turnover])"
So, in the chart, bar is displaying inv turnover for each Site for MonthYear and dot represent total turnover for each month i.e. why i have grouped it by MonthYear.
Thanks.
- « Previous Replies
- Next Replies »