Unlock a world of possibilities! Login now and discover the exclusive benefits awaiting you.
- Qlik Community
- :
- All Forums
- :
- QlikView App Dev
- :
- dynamic labels in waterfall chart using FirstSorte...
- Subscribe to RSS Feed
- Mark Topic as New
- Mark Topic as Read
- Float this Topic for Current User
- Bookmark
- Subscribe
- Mute
- Printer Friendly Page
- Mark as New
- Bookmark
- Subscribe
- Mute
- Subscribe to RSS Feed
- Permalink
- Report Inappropriate Content
dynamic labels in waterfall chart using FirstSortedValue
Hi there!
sooo.... I'm trying to make a waterfall chart...
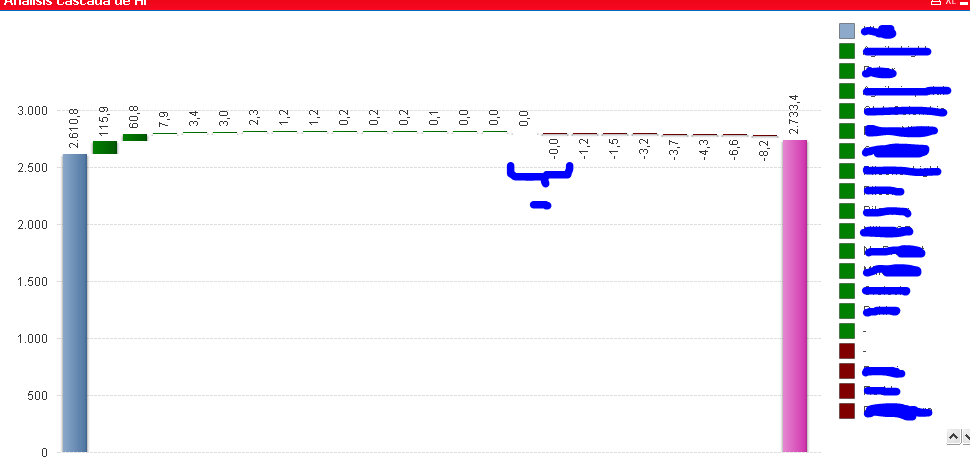
the pretty thing about this waterfall chart is that the expressions correspond each to the contribution of several brands between previous year and this year real values. Meaning that, the big bars, are the total volume sold in the interval, for all the brands.
as you may have seen, brands are organized DESC by the delta of the sales. I achieved this via
Max( Aggr( Sum($(=vAnalisisCascada)) - Sum({$<Mes = {$(vMaxMonth)}, Año = {$(vPriorYear)}, [Año fiscal]= > } $(=vAnalisisCascada)), Brand), 1) / 1e6 * If(vAnalisisCascada = 'Hl', 1e3, 1)
where I take the Max ( X, 1) the highest value for the first expression. then the Max(X, 2) for the second... and so forth...
this way I get the descending order in the expressions.
now... for the expression labels:
=FirstSortedValue(Brand, -Aggr(Sum($(=vAnalisisCascada)) - Sum({$<Mes = {$(vMaxMonth)}, Año = {$(vPriorYear)}, [Año fiscal]= > } $(=vAnalisisCascada)), Marca), 1)
I use FirstSortedValue, to get the Brand which corresponds to the position the expression is supposed to be evaluating, and for the sort weight I used the same formula as in the expression. here I increase the FirstSortedValue(X, 1) for each label... so I think my idea is quite right
yet... time for the question:
the labels seem to work fine, but there is some unstability around 0..... I don't have a clue about why some of the brands are being hidden...
just checked and some of the labels are malfunctioning... the brands are not appearing where their number is....
what should I do about the labels???
- Tags:
- aggr
- label_expression