Unlock a world of possibilities! Login now and discover the exclusive benefits awaiting you.
- Qlik Community
- :
- All Forums
- :
- QlikView App Dev
- :
- dynamic scale
- Subscribe to RSS Feed
- Mark Topic as New
- Mark Topic as Read
- Float this Topic for Current User
- Bookmark
- Subscribe
- Mute
- Printer Friendly Page
- Mark as New
- Bookmark
- Subscribe
- Mute
- Subscribe to RSS Feed
- Permalink
- Report Inappropriate Content
dynamic scale
It doesn't work the automatic scale. The lines go out of the chart. Can anyone help me? Thank you!
- Tags:
- new_to_qlikview
- Mark as New
- Bookmark
- Subscribe
- Mute
- Subscribe to RSS Feed
- Permalink
- Report Inappropriate Content
Make sure there is no value set for the Static Max setting on the Axes tab for the expression axis.
talk is cheap, supply exceeds demand
- Mark as New
- Bookmark
- Subscribe
- Mute
- Subscribe to RSS Feed
- Permalink
- Report Inappropriate Content
Remove Static Min, Static Max and Static Step from the chart under the Axes tab. This should work.
If that doesn't work you can change the Static Max to be the largest value of your data set by using MAX() function and the Static Min by using the MIN() function.
- Mark as New
- Bookmark
- Subscribe
- Mute
- Subscribe to RSS Feed
- Permalink
- Report Inappropriate Content
The problem is that the automatic scale of some expression work well but in other not and I cant find the problem.
- Mark as New
- Bookmark
- Subscribe
- Mute
- Subscribe to RSS Feed
- Permalink
- Report Inappropriate Content
The Static Min, Static Max and Static Step from the chart under the Axes tab are removed
- Mark as New
- Bookmark
- Subscribe
- Mute
- Subscribe to RSS Feed
- Permalink
- Report Inappropriate Content
Try and create a MIN and MAX yourself by using MIN() and MAX() around your expressions, so if you have SUM(Sales), use MIN a MIN(Sales) and MAX as MAX(Sales).
Hope this helps
- Mark as New
- Bookmark
- Subscribe
- Mute
- Subscribe to RSS Feed
- Permalink
- Report Inappropriate Content
You can use RangeMin() and RangeMax() for Static Min and Static Max scale respectively.
- Mark as New
- Bookmark
- Subscribe
- Mute
- Subscribe to RSS Feed
- Permalink
- Report Inappropriate Content
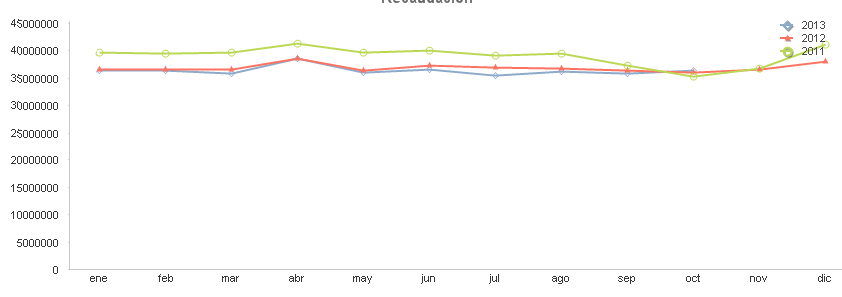
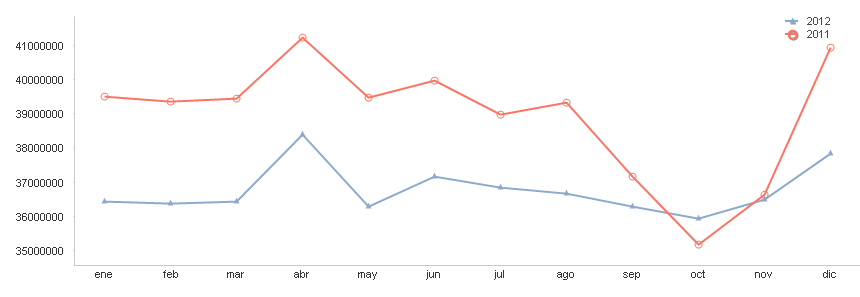
this is my problem. It works when I inhabilitate the year 2013 but when the three years are together the chart doesn´t work automatically. In the opction axis in the chart all the option are the same for the three years. So I can´t guess the problem. Thank you again 
- Mark as New
- Bookmark
- Subscribe
- Mute
- Subscribe to RSS Feed
- Permalink
- Report Inappropriate Content
What happens if you remove a different year?
Are the year lines defined individually as calculated expressions? or are they just defined as a year field?
For this I think that you will definitely need a MIN value for the minimum axis .....