Unlock a world of possibilities! Login now and discover the exclusive benefits awaiting you.
- Qlik Community
- :
- All Forums
- :
- QlikView App Dev
- :
- export
- Subscribe to RSS Feed
- Mark Topic as New
- Mark Topic as Read
- Float this Topic for Current User
- Bookmark
- Subscribe
- Mute
- Printer Friendly Page
- Mark as New
- Bookmark
- Subscribe
- Mute
- Subscribe to RSS Feed
- Permalink
- Report Inappropriate Content
export
Hi all , iam facing a strange issue. I have starlight table where i have the sum showing up for the expressions. But the strange side here is after downloaded my sum when manually checked in excel is having different sums for ex:
column ! in chart is 10009.33 but after download it is 1110.55
- Mark as New
- Bookmark
- Subscribe
- Mute
- Subscribe to RSS Feed
- Permalink
- Report Inappropriate Content
What is your expression?
To see the real sum of all rows select the option below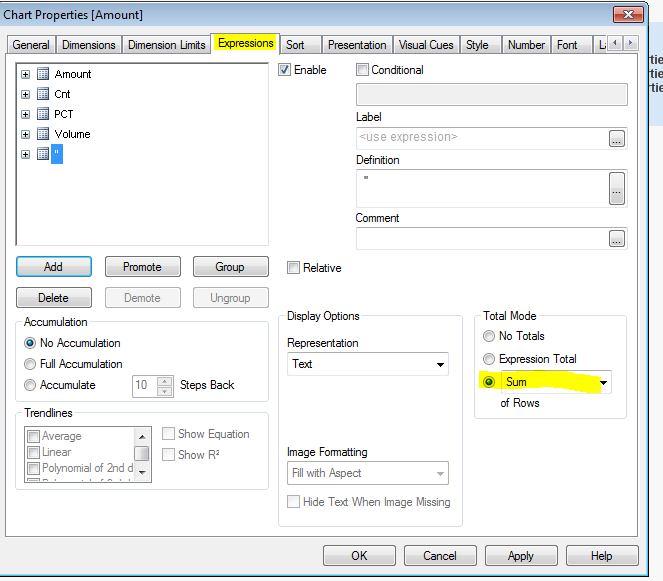
- Mark as New
- Bookmark
- Subscribe
- Mute
- Subscribe to RSS Feed
- Permalink
- Report Inappropriate Content
Show me the screenshot, Because some time it's possible. Quite brief was try again with Diff path and see
- Mark as New
- Bookmark
- Subscribe
- Mute
- Subscribe to RSS Feed
- Permalink
- Report Inappropriate Content
Hi,
Try below steps.
1. Go to Properties of Straight Table
2. Go to Expression Tab
3. Click on Expression
4. Right Side Center there is an option called Total Mode.
5. Select 3rd option
6. Select Sum
Click on Apply
This will solve your issue.
At times the total may seems to be wrong, this happens because of the null values in data.
In such case change the expression using advanced aggregation function, like below.
Sum(Aggr(Sum(Amount),Dimension 1,Dimension 2))
Assuming that you have 2 dimensions in chart.
Hope this helps.
Regards,
Kaushik Solanki
- Mark as New
- Bookmark
- Subscribe
- Mute
- Subscribe to RSS Feed
- Permalink
- Report Inappropriate Content
thanks indeed it was issue with Sum.. Can anybody tell me what is the difference between Total and Sum
- Mark as New
- Bookmark
- Subscribe
- Mute
- Subscribe to RSS Feed
- Permalink
- Report Inappropriate Content
Load * Inline [
Name, Sales
A, 10
B, 20
C, 30
];
By using Sum(Sales) You will get same O/P
By using Sum(TOTAL Sales)
Name, Sales
A, 60
B, 60
C, 60
- Mark as New
- Bookmark
- Subscribe
- Mute
- Subscribe to RSS Feed
- Permalink
- Report Inappropriate Content
anybody could explain in another wayy
- Mark as New
- Bookmark
- Subscribe
- Mute
- Subscribe to RSS Feed
- Permalink
- Report Inappropriate Content
As Anil mentioned above,
Using a normal sum will consider the dimension when displaying in a chart.
Using TOTAL will sum ALL values and Ignore the dimension during the calculation.
If TOTAL is used in conjunction with <field> the calculation will be done on a group by group basis instead of the entire total.
i.e - Taken from Qlikview help file
Study the representation of a straight table below:
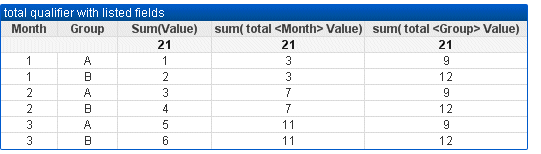
In the third expression column (sum(total<Month> Val)) one total is calculated for each month.
In the fourth expression column (sum(total<Grp> Val)) one total is calculated for each group.
sum(TOTAL Val) will just repeat the overall total of 21 across all records in the above chart