Unlock a world of possibilities! Login now and discover the exclusive benefits awaiting you.
- Qlik Community
- :
- All Forums
- :
- QlikView App Dev
- :
- expression working fine in table chart but not in ...
- Subscribe to RSS Feed
- Mark Topic as New
- Mark Topic as Read
- Float this Topic for Current User
- Bookmark
- Subscribe
- Mute
- Printer Friendly Page
- Mark as New
- Bookmark
- Subscribe
- Mute
- Subscribe to RSS Feed
- Permalink
- Report Inappropriate Content
expression working fine in table chart but not in bar chart
Hi all,
this is really bugging me and i cant get to the bottom of it!
attached is a qvw with 2 sheets. 1 with a table and 1 with a chart (named accordingly)
the table and the chart are exactly the same WRT dimensions and expressions.
long story short I have a background colour expression that works fine in the table but not in the chart and i cant work out why.
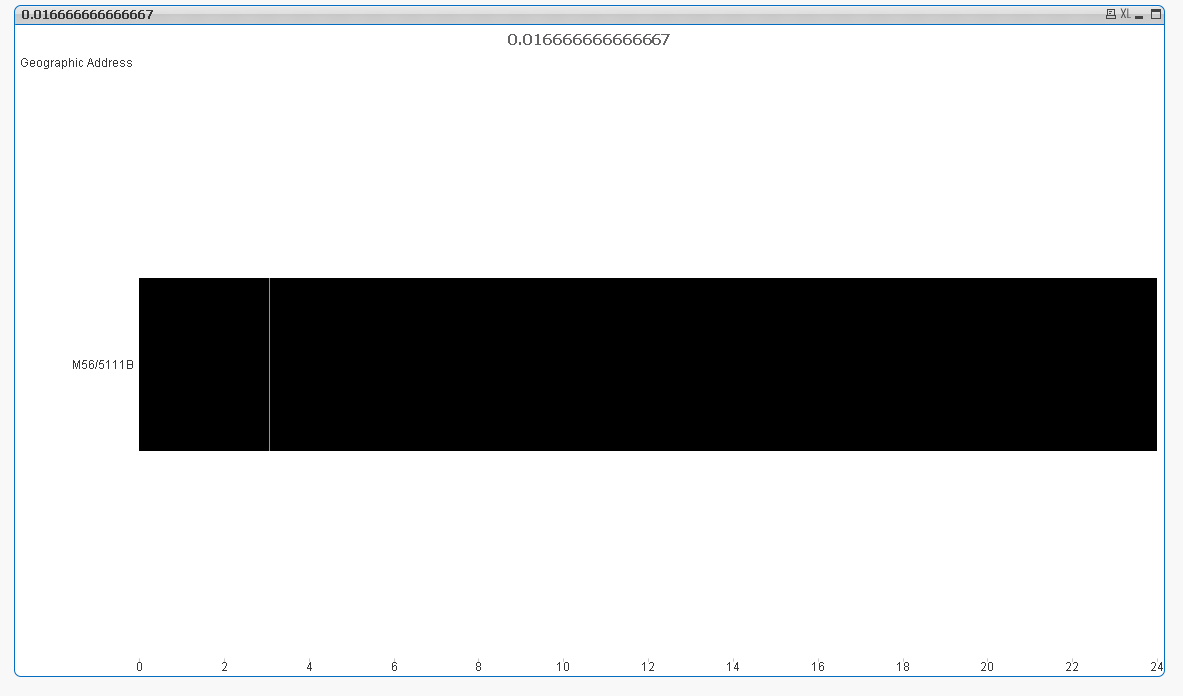
an example is if you navigate to geographic address M56/5111B and in the table scroll down to 3:04 you will see the box has turned green as it should according to the formula. have a look at the chart though and it hasnt?
i realise my explanation is terrible and for that i apologise but its simply becuase i dont know whats so im unable to target my question.
please do take a look and hopefully you should see what i mean.
as always thanks guys.
Accepted Solutions
- Mark as New
- Bookmark
- Subscribe
- Mute
- Subscribe to RSS Feed
- Permalink
- Report Inappropriate Content
If I slightly increase the size of the chart, it actually does show the green
- Mark as New
- Bookmark
- Subscribe
- Mute
- Subscribe to RSS Feed
- Permalink
- Report Inappropriate Content
If I slightly increase the size of the chart, it actually does show the green
- Mark as New
- Bookmark
- Subscribe
- Mute
- Subscribe to RSS Feed
- Permalink
- Report Inappropriate Content
id love to be able to laugh at myself for that one cheers.
any clue why some would appear and some wont, just for information?
cheers
- Mark as New
- Bookmark
- Subscribe
- Mute
- Subscribe to RSS Feed
- Permalink
- Report Inappropriate Content
Some would appear? So without resizing it shows green for some selections? That is indeed weird. May be the interval is bigger and it is able to show it, but with just one cell green, the space isn't enough. Not sure, but can you share a selection where it actually display a value?