Unlock a world of possibilities! Login now and discover the exclusive benefits awaiting you.
- Qlik Community
- :
- All Forums
- :
- QlikView App Dev
- :
- find difference in Pivot table
- Subscribe to RSS Feed
- Mark Topic as New
- Mark Topic as Read
- Float this Topic for Current User
- Bookmark
- Subscribe
- Mute
- Printer Friendly Page
- Mark as New
- Bookmark
- Subscribe
- Mute
- Subscribe to RSS Feed
- Permalink
- Report Inappropriate Content
find difference in Pivot table
Hi guys,
I have a pivot table
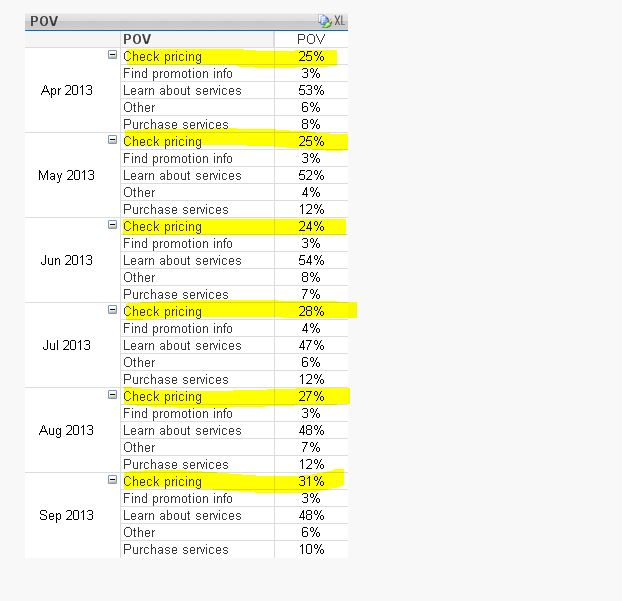
I want to calculate difference between the same tag from previous period.
Other words: Check pricing Sep 2013 31%-Check pricing Aug 2013 27% = dif 4% and so on.
When I use above or below, it calculates for Sep 2013 31%-3%=28%; 3%-48%=-45% and so on in one current month.
But I'd like compare the same but with previous period.
Please see the attached file.
Thanks,
- Tags:
- new_to_qlikview
Accepted Solutions
- Mark as New
- Bookmark
- Subscribe
- Mute
- Subscribe to RSS Feed
- Permalink
- Report Inappropriate Content
Why not? Please check attached
- Mark as New
- Bookmark
- Subscribe
- Mute
- Subscribe to RSS Feed
- Permalink
- Report Inappropriate Content
Your idea using chart inter record functions is good, you just need to add advanced aggregation to tell QV the correct dimension order.
Check attached.
- Mark as New
- Bookmark
- Subscribe
- Mute
- Subscribe to RSS Feed
- Permalink
- Report Inappropriate Content
Hi
Try like this
Alt(aggr(
Count({<[qID_2_Primary purpose of visit]={'Learn about services','Check pricing','Purchase Vonage services','Find promotion info','Buy Vonage services','Other'}>}POV)/Count(TOTAL <MYear> POV)
-
above(
Count({<[qID_2_Primary purpose of visit]={'Learn about services','Check pricing','Purchase Vonage services','Find promotion info','Buy Vonage services','Other'}>}POV)/Count(TOTAL <MYear> POV)
)
,POV,MYear),0)
Please close the thread by marking correct answer & give likes if you like the post.
- Mark as New
- Bookmark
- Subscribe
- Mute
- Subscribe to RSS Feed
- Permalink
- Report Inappropriate Content
Thanks for suggestion
My original expression is bigger.
It works, when I switch dimensions (instead of Above, I use before)
I can't switch dimensions in my chart.
Please see my file.
- Mark as New
- Bookmark
- Subscribe
- Mute
- Subscribe to RSS Feed
- Permalink
- Report Inappropriate Content
Thanks for suggestion
My original expression is bigger.
It works, when I switch dimensions (instead of Above, I use before)
I can't switch dimensions in my chart.
Please see my file.
- Mark as New
- Bookmark
- Subscribe
- Mute
- Subscribe to RSS Feed
- Permalink
- Report Inappropriate Content
Why not? Please check attached
- Mark as New
- Bookmark
- Subscribe
- Mute
- Subscribe to RSS Feed
- Permalink
- Report Inappropriate Content
Thanks. You're awesome